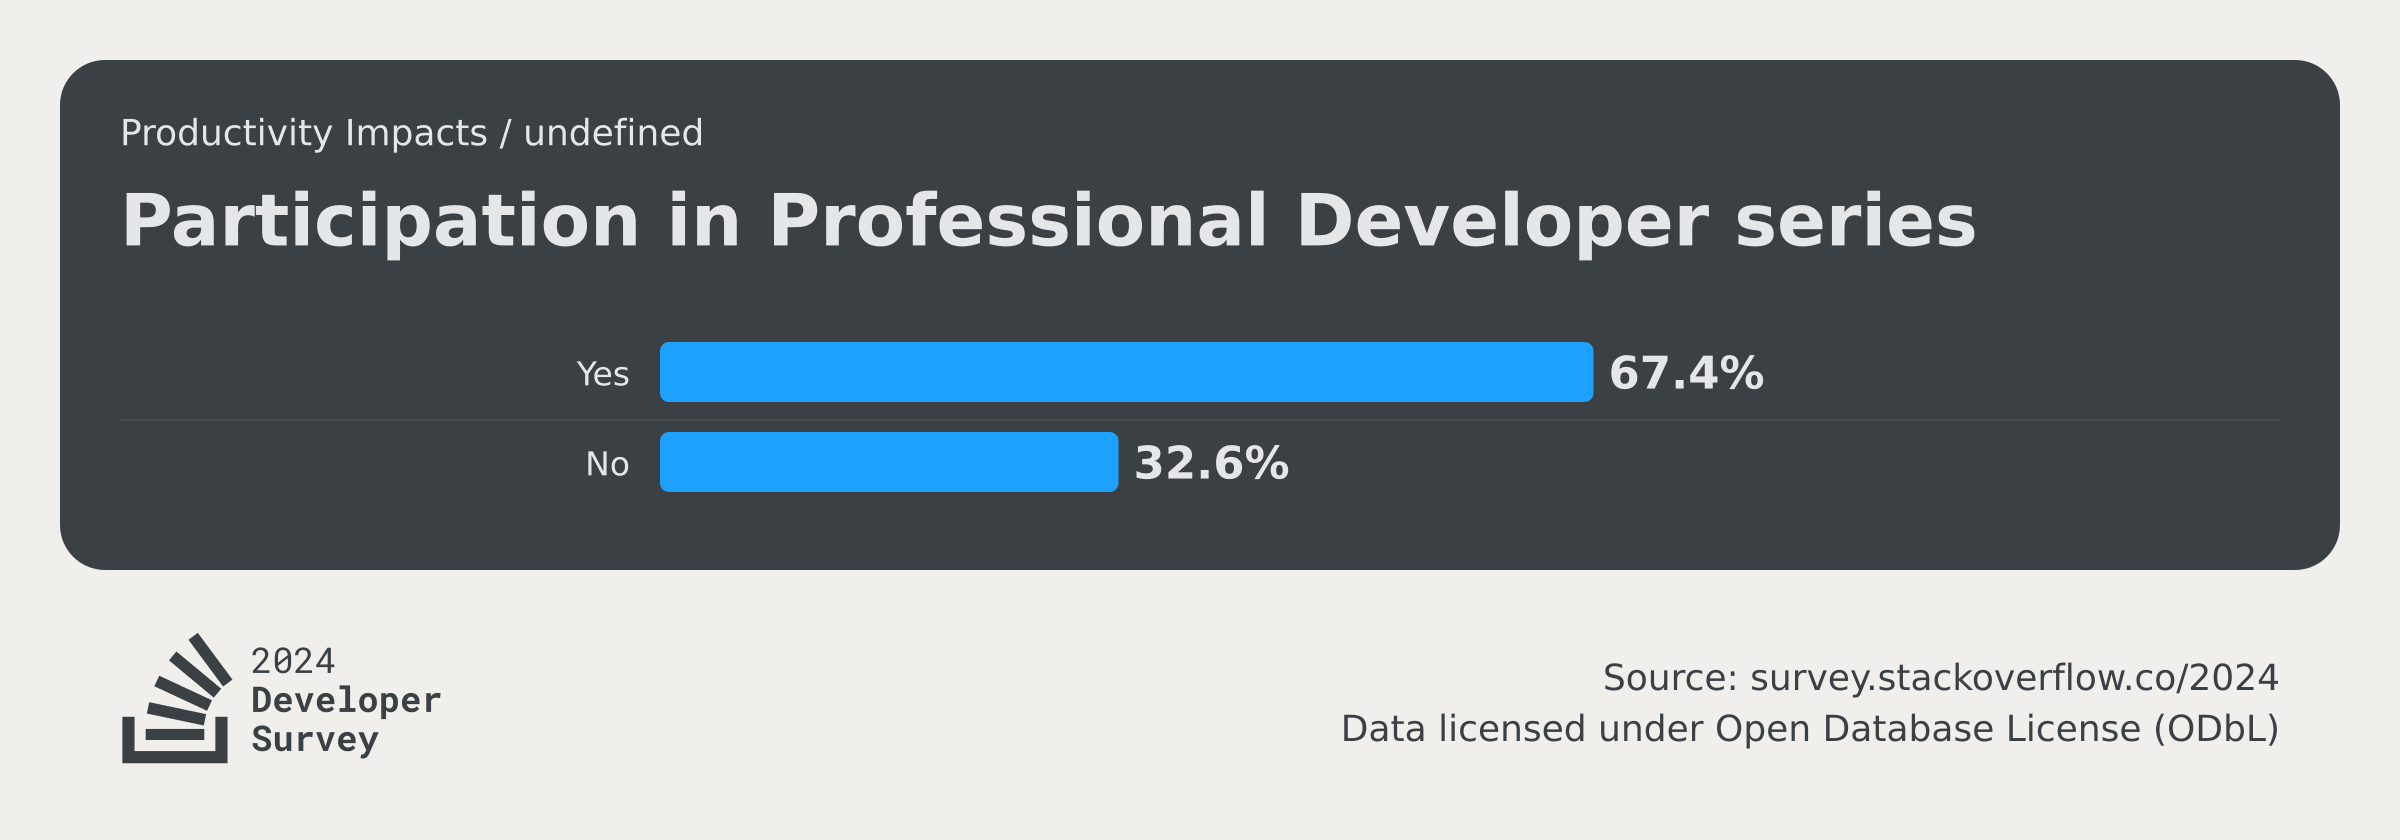
Participation in Professional Developer series
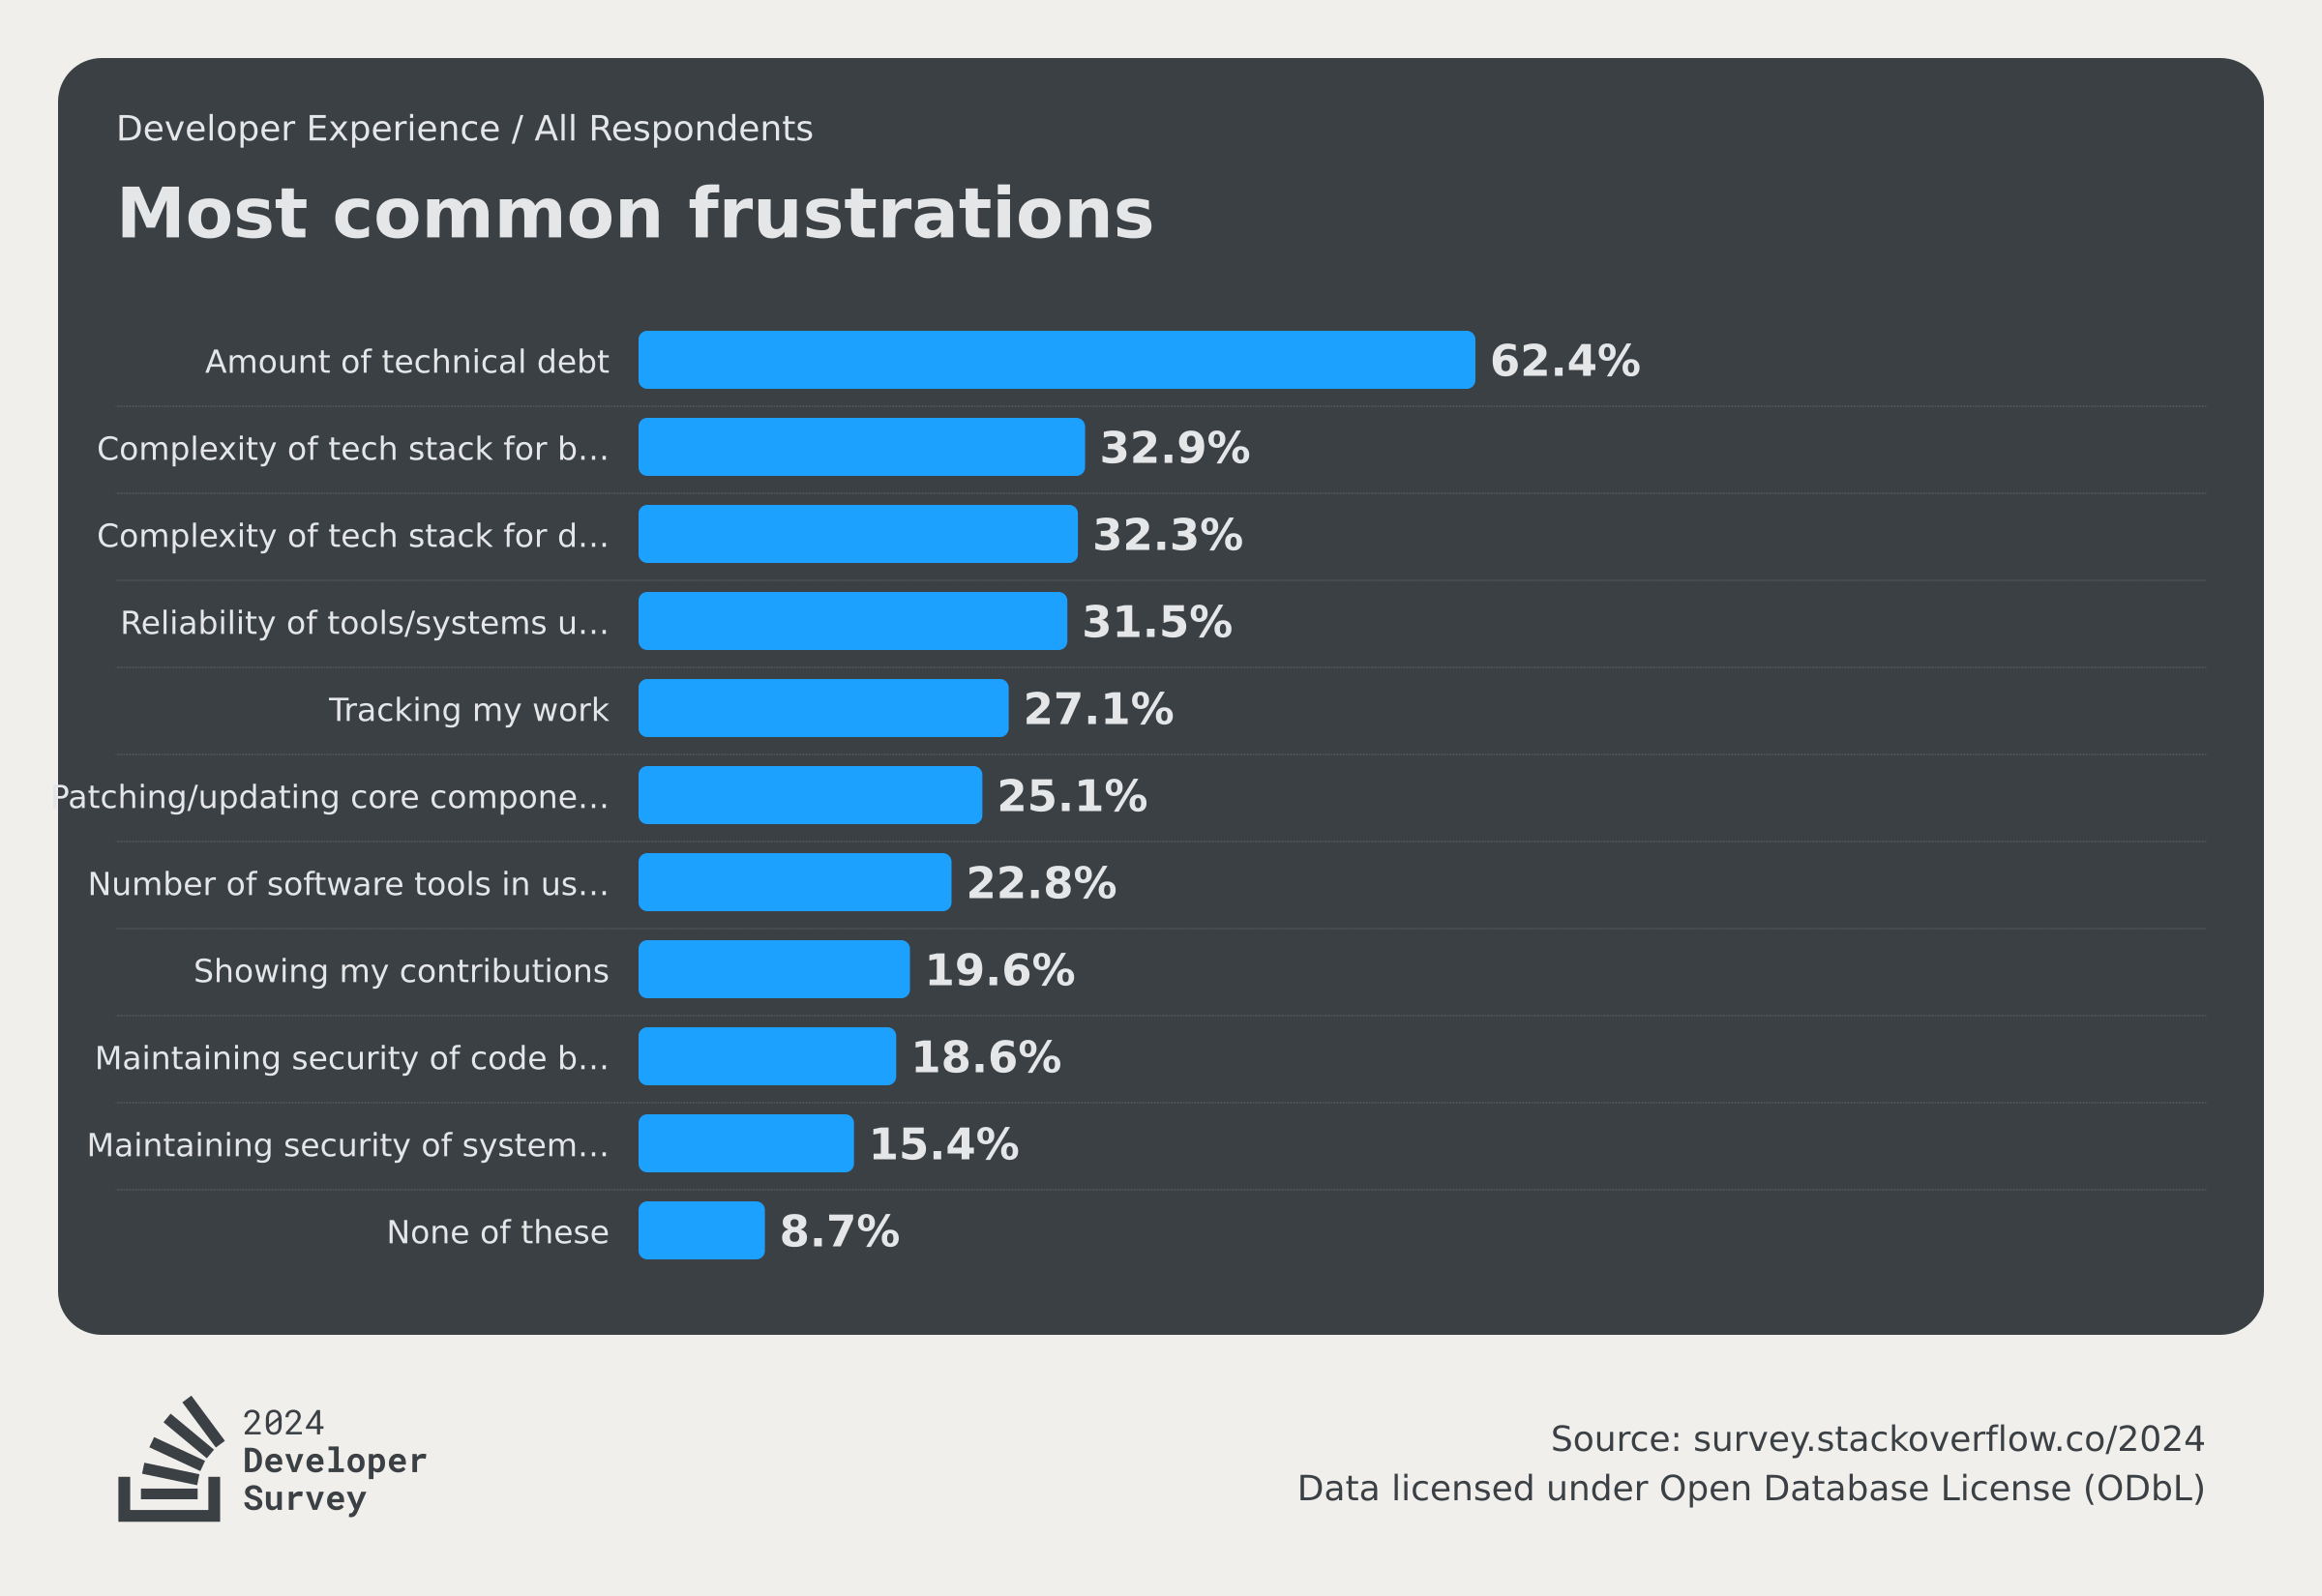
Roughly 29K professional developers contributed to this year's Professional Developer section of questions from the Developer Survey all about productivity and satisfaction at work.
Would you like to participate in the Professional Developer Series? *
Responses:
44,477 (68%)