2024 Developer Survey

4 Work

Developers tell us about workplace trends and offer some transparency about salary for different roles and experience levels.

4.1 Employment

Employment status

84% of respondents are working: either part-time, freelancing, or full-time.

Which of the following best describes your current employment status? Select all that apply.*
All Respondents to-do Employed, full-time69%Independent contractor, freela…16.4%Student, full-time13.2%Employed, part-time6.3%Not employed, but looking for…6%Student, part-time4.1%Not employed, and not looking…1.8%Retired1%I prefer not to say0.8%
Responses: 65,437 (100%)
Professional Developers to-do Employed, full-time80.7%Independent contractor, freela…17.9%Employed, part-time5.8%Student, full-time4.5%Not employed, but looking for…3.9%Student, part-time3.2%Not employed, and not looking…0.5%I prefer not to say0.4%Retired0.3%
Responses: 49,390 (75.5%)

Employment status by geography

Full-time employment has decreased in the U.S. since last year's survey (69% to 65%). Looking at employment in the top five countries, in the U.K. and Ukraine respondents not employed full-time are more likely to be independent contractors and in Germany and India are more likely to be a full-time student if not employed full-time.

Which of the following best describes your current employment status? Select all that apply.*
United States to-do Employed, full-time64.8%Independent contractor, freela…11.1%Student, full-time9.1%Not employed, but looking for…5%Employed, part-time3.4%Student, part-time2.2%Retired2%Not employed, and not looking…1.6%I prefer not to say0.8%
Responses: 12,785 (19.5%)
Germany to-do Employed, full-time56.3%Student, full-time13.8%Employed, part-time11%Independent contractor, freela…10.5%Student, part-time4%Not employed, but looking for…1.9%Not employed, and not looking…1.1%Retired0.7%I prefer not to say0.6%
Responses: 5,858 (9%)
India to-do Employed, full-time55.9%Student, full-time16.6%Independent contractor, freela…10.7%Not employed, but looking for…8.5%Student, part-time2.9%Employed, part-time2.9%Not employed, and not looking…1.5%I prefer not to say0.8%Retired0.2%
Responses: 4,867 (7.4%)
United Kingdom to-do Employed, full-time66.4%Independent contractor, freela…12.3%Student, full-time9.6%Not employed, but looking for…3.6%Employed, part-time3%Retired2.1%Not employed, and not looking…1.4%Student, part-time1.2%I prefer not to say0.4%
Responses: 3,538 (5.4%)
Ukraine to-do Employed, full-time60.9%Independent contractor, freela…14.6%Not employed, but looking for…8.6%Student, full-time8.3%Employed, part-time3.6%Student, part-time2.1%Not employed, and not looking…1.4%I prefer not to say0.4%Retired0.1%
Responses: 3,392 (5.2%)

Work environment

The number of hybrid developers has stayed consistent this year with last year (42%), while the percentage of developers working in-person has increased (20%) for the third year in a row compared to 15% in 2022 and 16% in 2023.

Which best describes your current work situation?
All Respondents to-do Hybrid 42%Remote38%In-person20%
Responses: 54,806 (83.8%)
By Organization Size to-do 3.8% 7.9% 7.1% 19.3% 19% 7.1% 13.5% 4.6% 15.3% 2.2%Hybrid (some remote, some in-person) 2.3% 11.9% 11.7% 25.9% 18.1% 6.4% 9.2% 3.4% 8.4% 2.7%In-person 11.3% 11.9% 8.7% 19.4% 17.7% 6.4% 9.8% 3.5% 9.3% 2.1%RemoteJust me - I am a freelancer, sole proprietor, etc.Just me2 to 9 employees10 to 19 employees20 to 99 employees100 to 499 employees500 to 999 employees1,000 to 4,999 employees5,000 to 9,999 employees10,000 or more employeesI don’t know
Responses: 47,443 (72.5%)

4.2 Company info

Company size

47% of respondents work for organizations that have fewer than 100 employees.

Approximately how many people are employed by the company or organization you currently work for? This should only include your primary company, and not the entire holding or parent company if that applies.
All Respondents to-do Just me - I am a freelancer, s…6.1%2 to 9 employees10.4%10 to 19 employees8.9%20 to 99 employees21.2%100 to 499 employees18.5%500 to 999 employees6.7%1,000 to 4,999 employees11%5,000 to 9,999 employees3.8%10,000 or more employees11.4%I don’t know2%
Responses: 42,827 (65.4%)

4.3 Salary

Salary by developer type

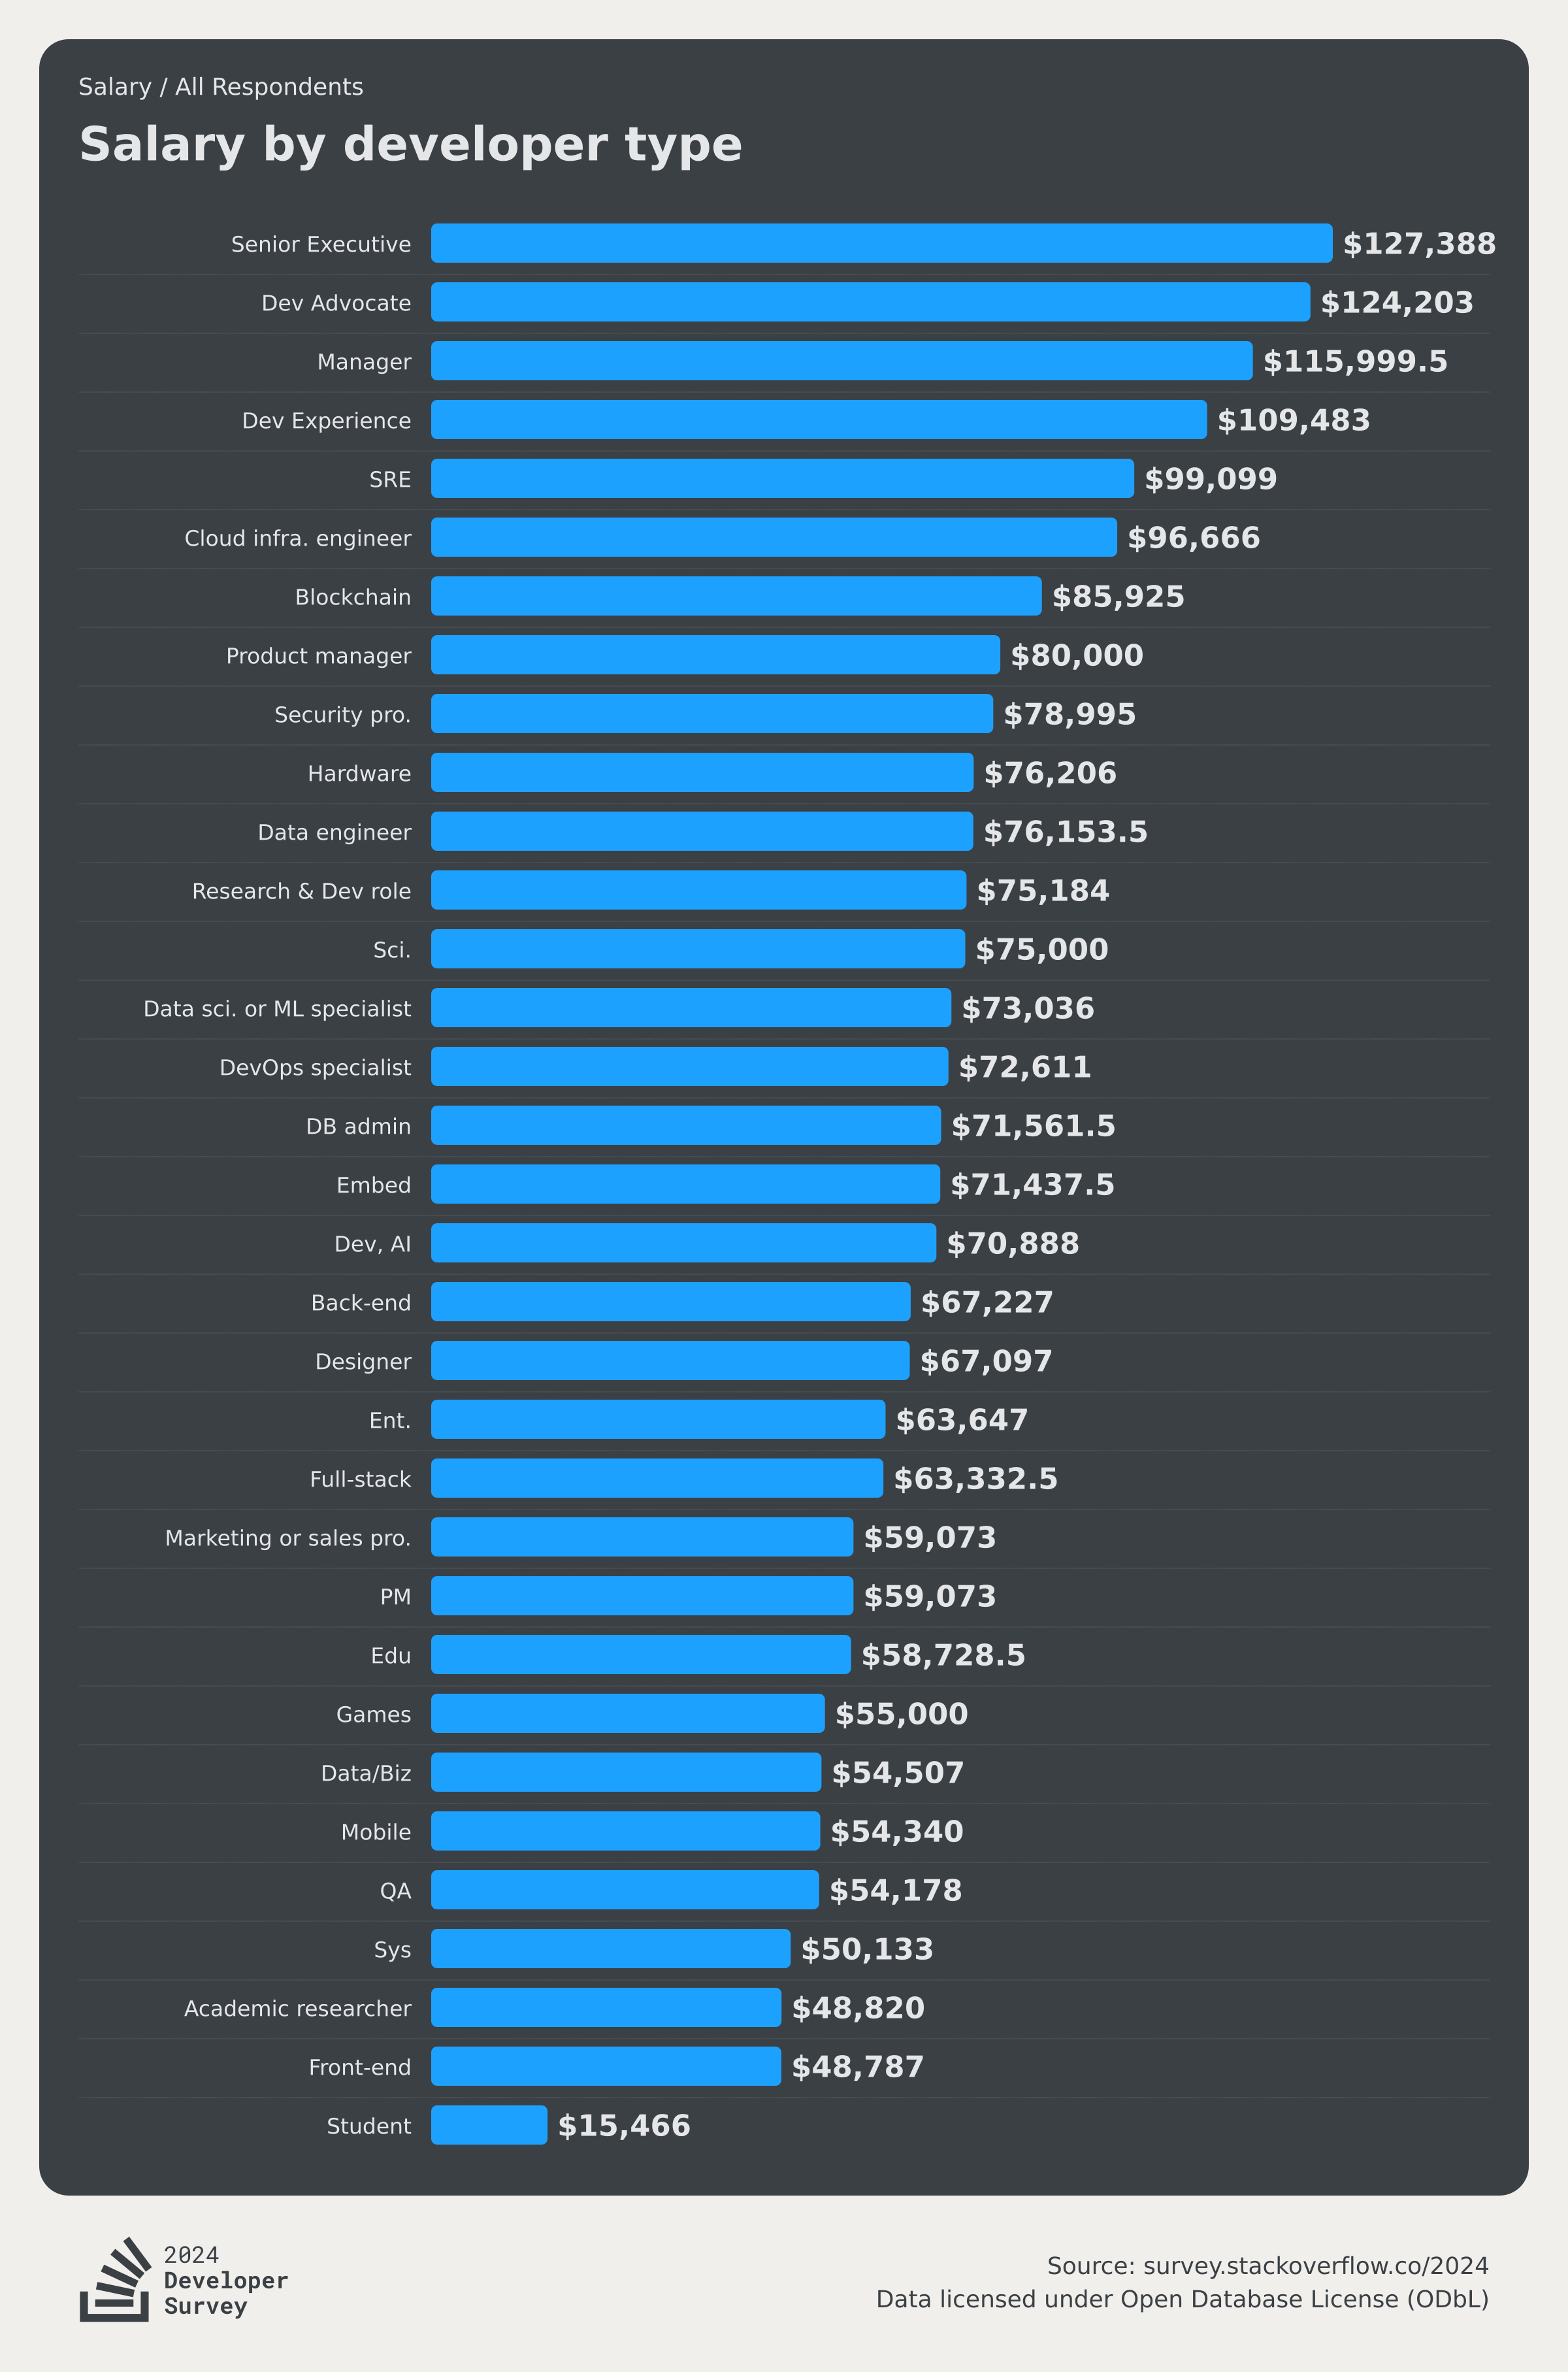
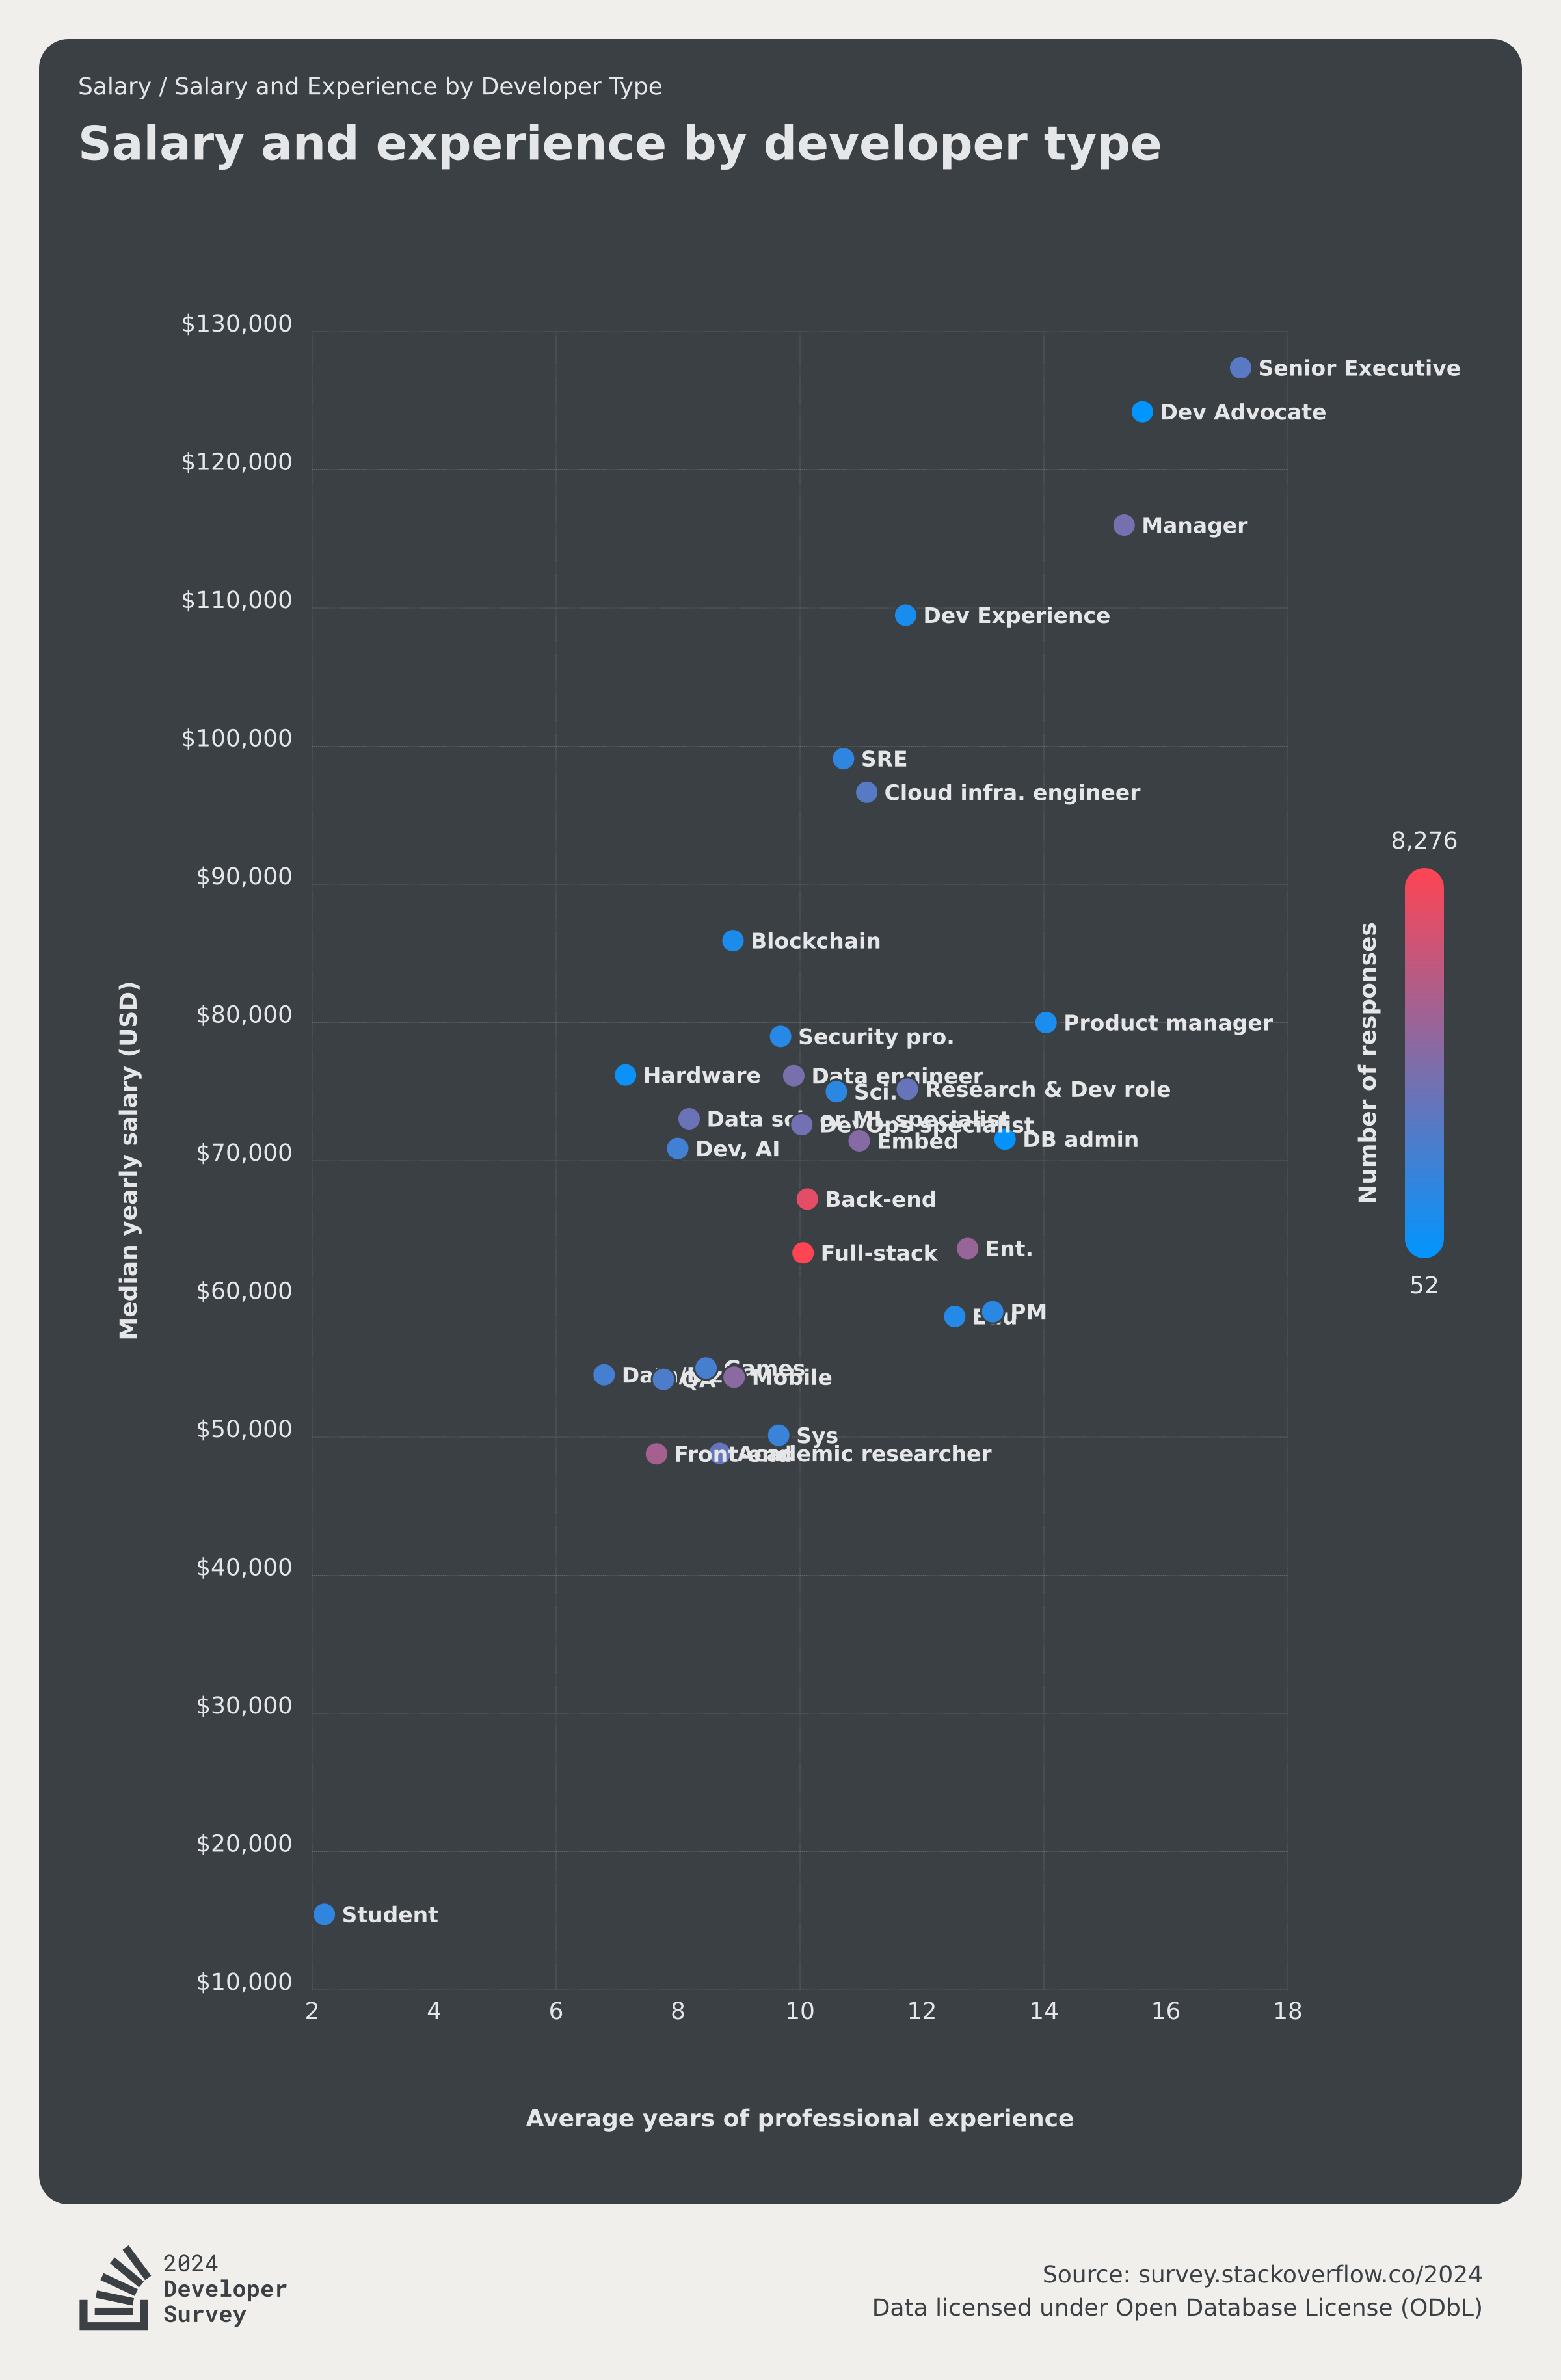
The highest-paid developers of all respondents are site reliability and cloud infrastructure engineers, as both roles are pivotal in keeping digital services up and running.

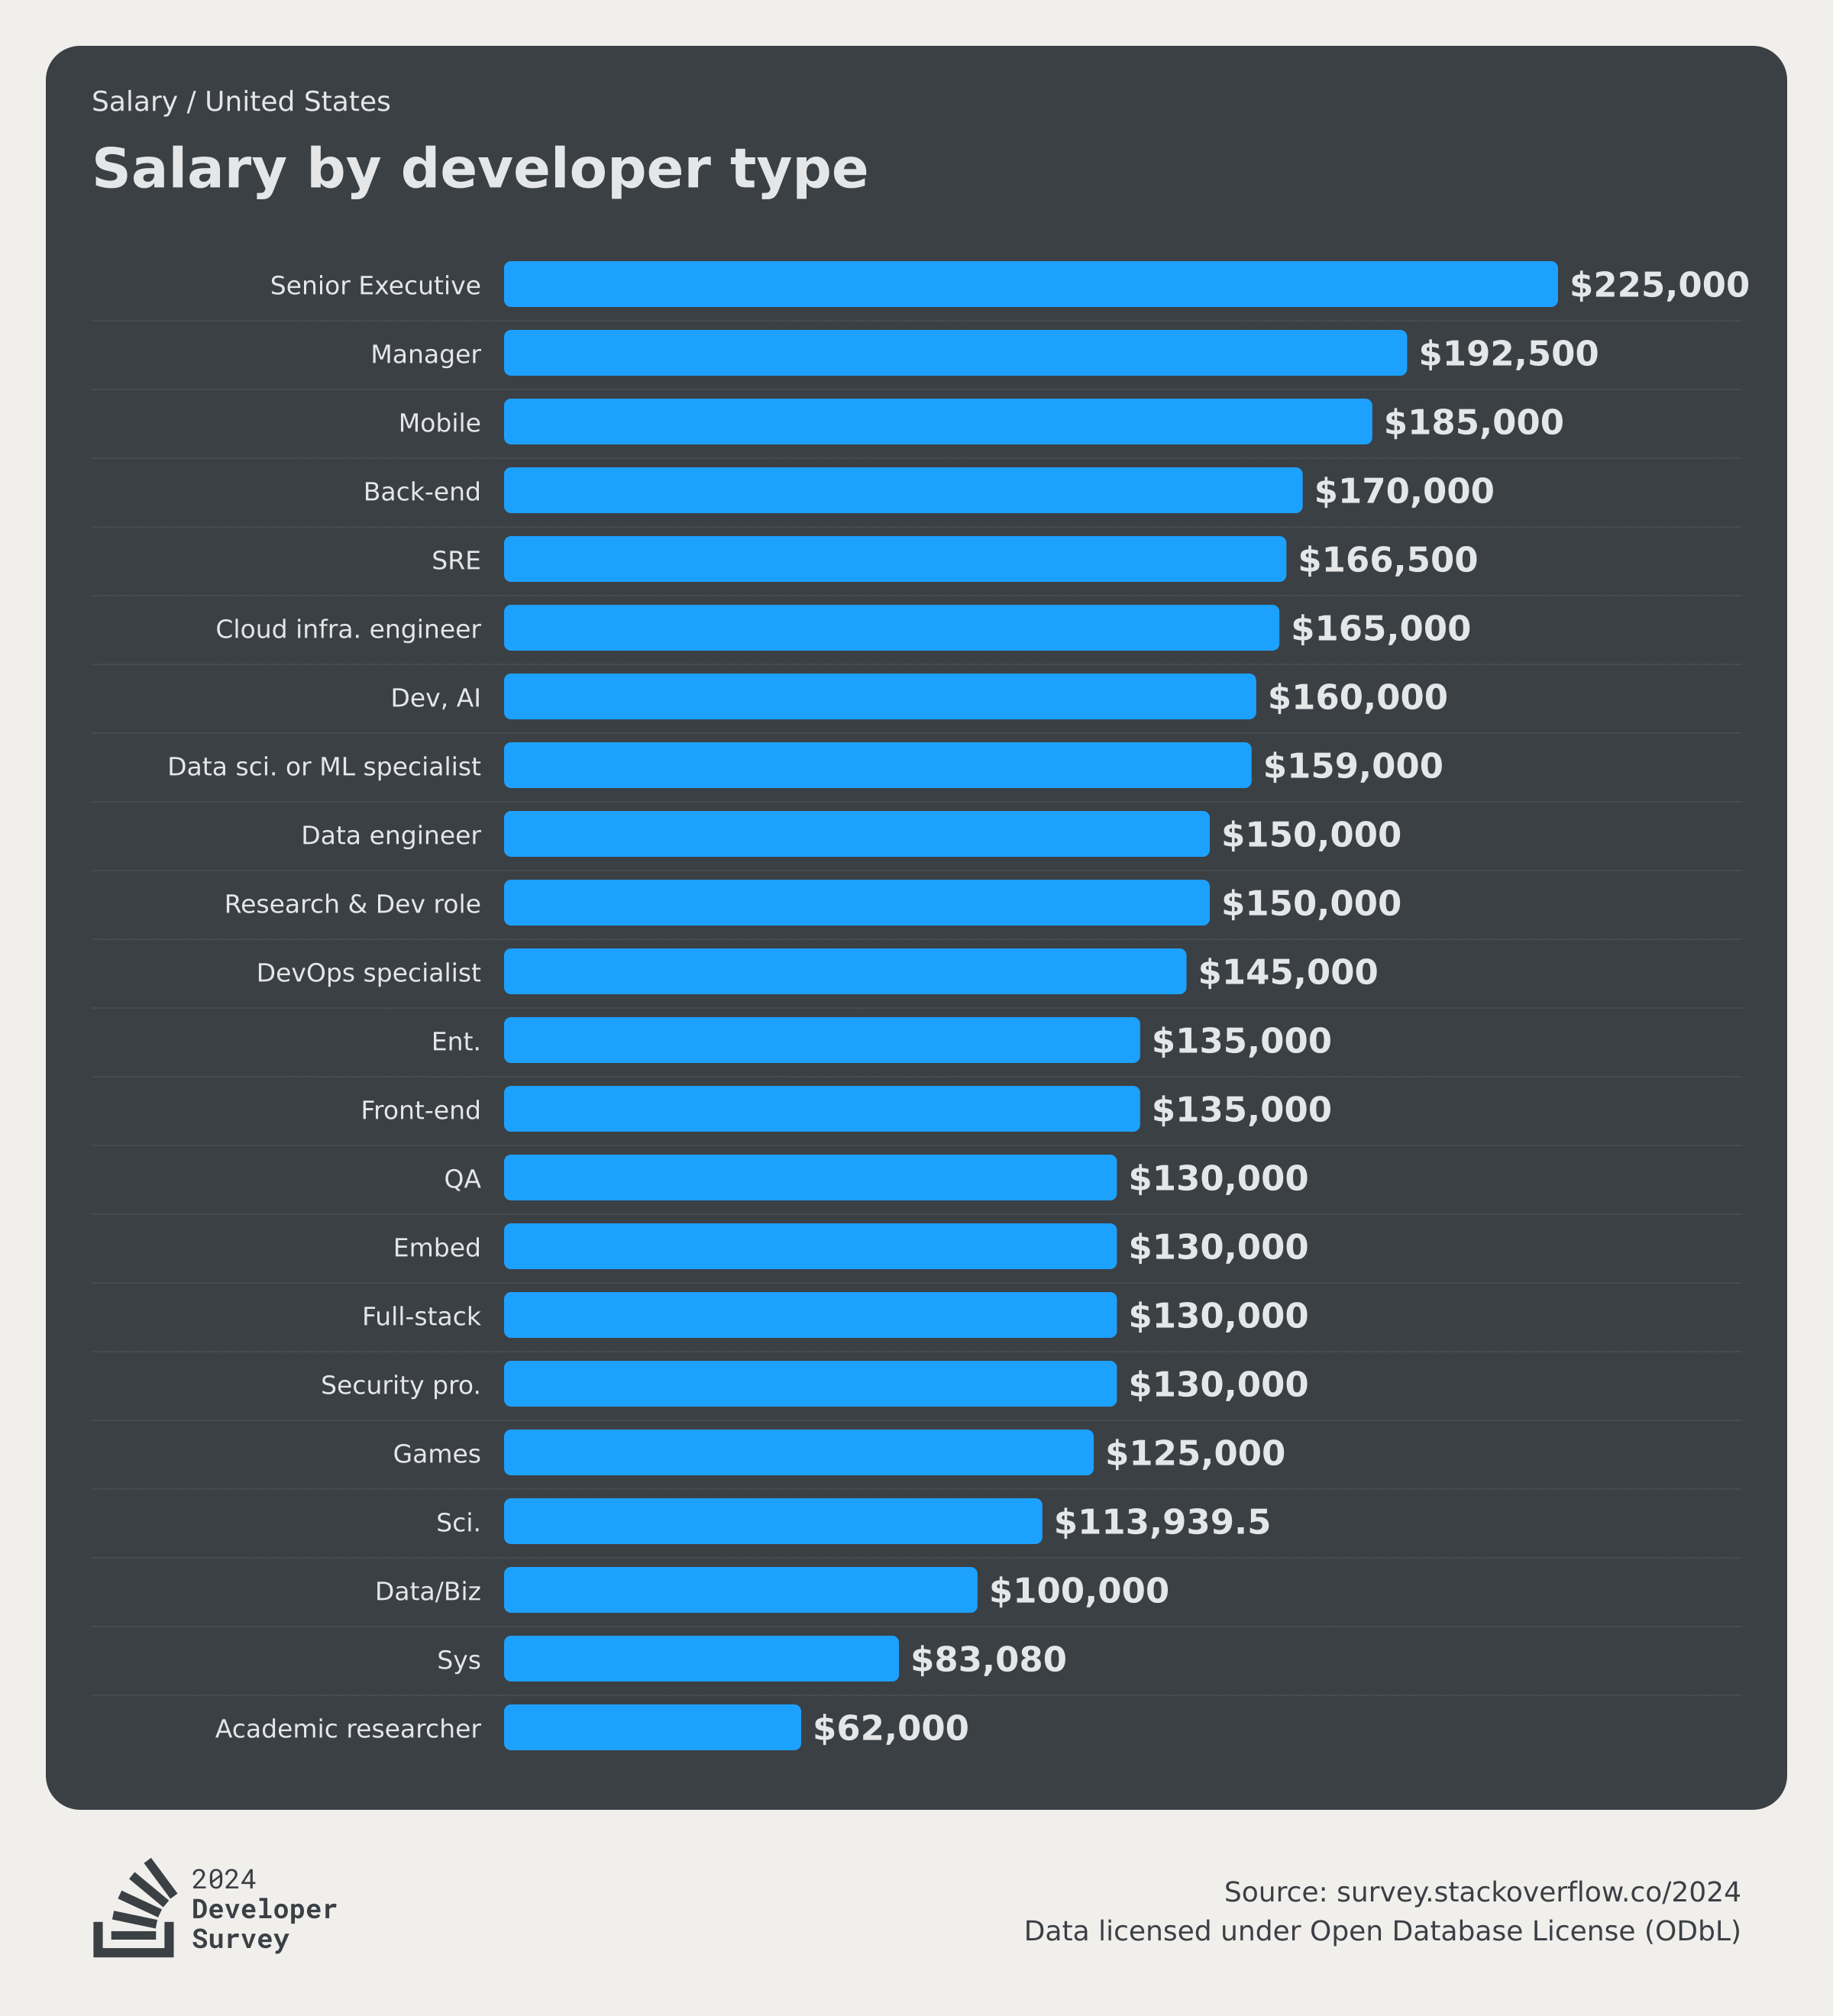
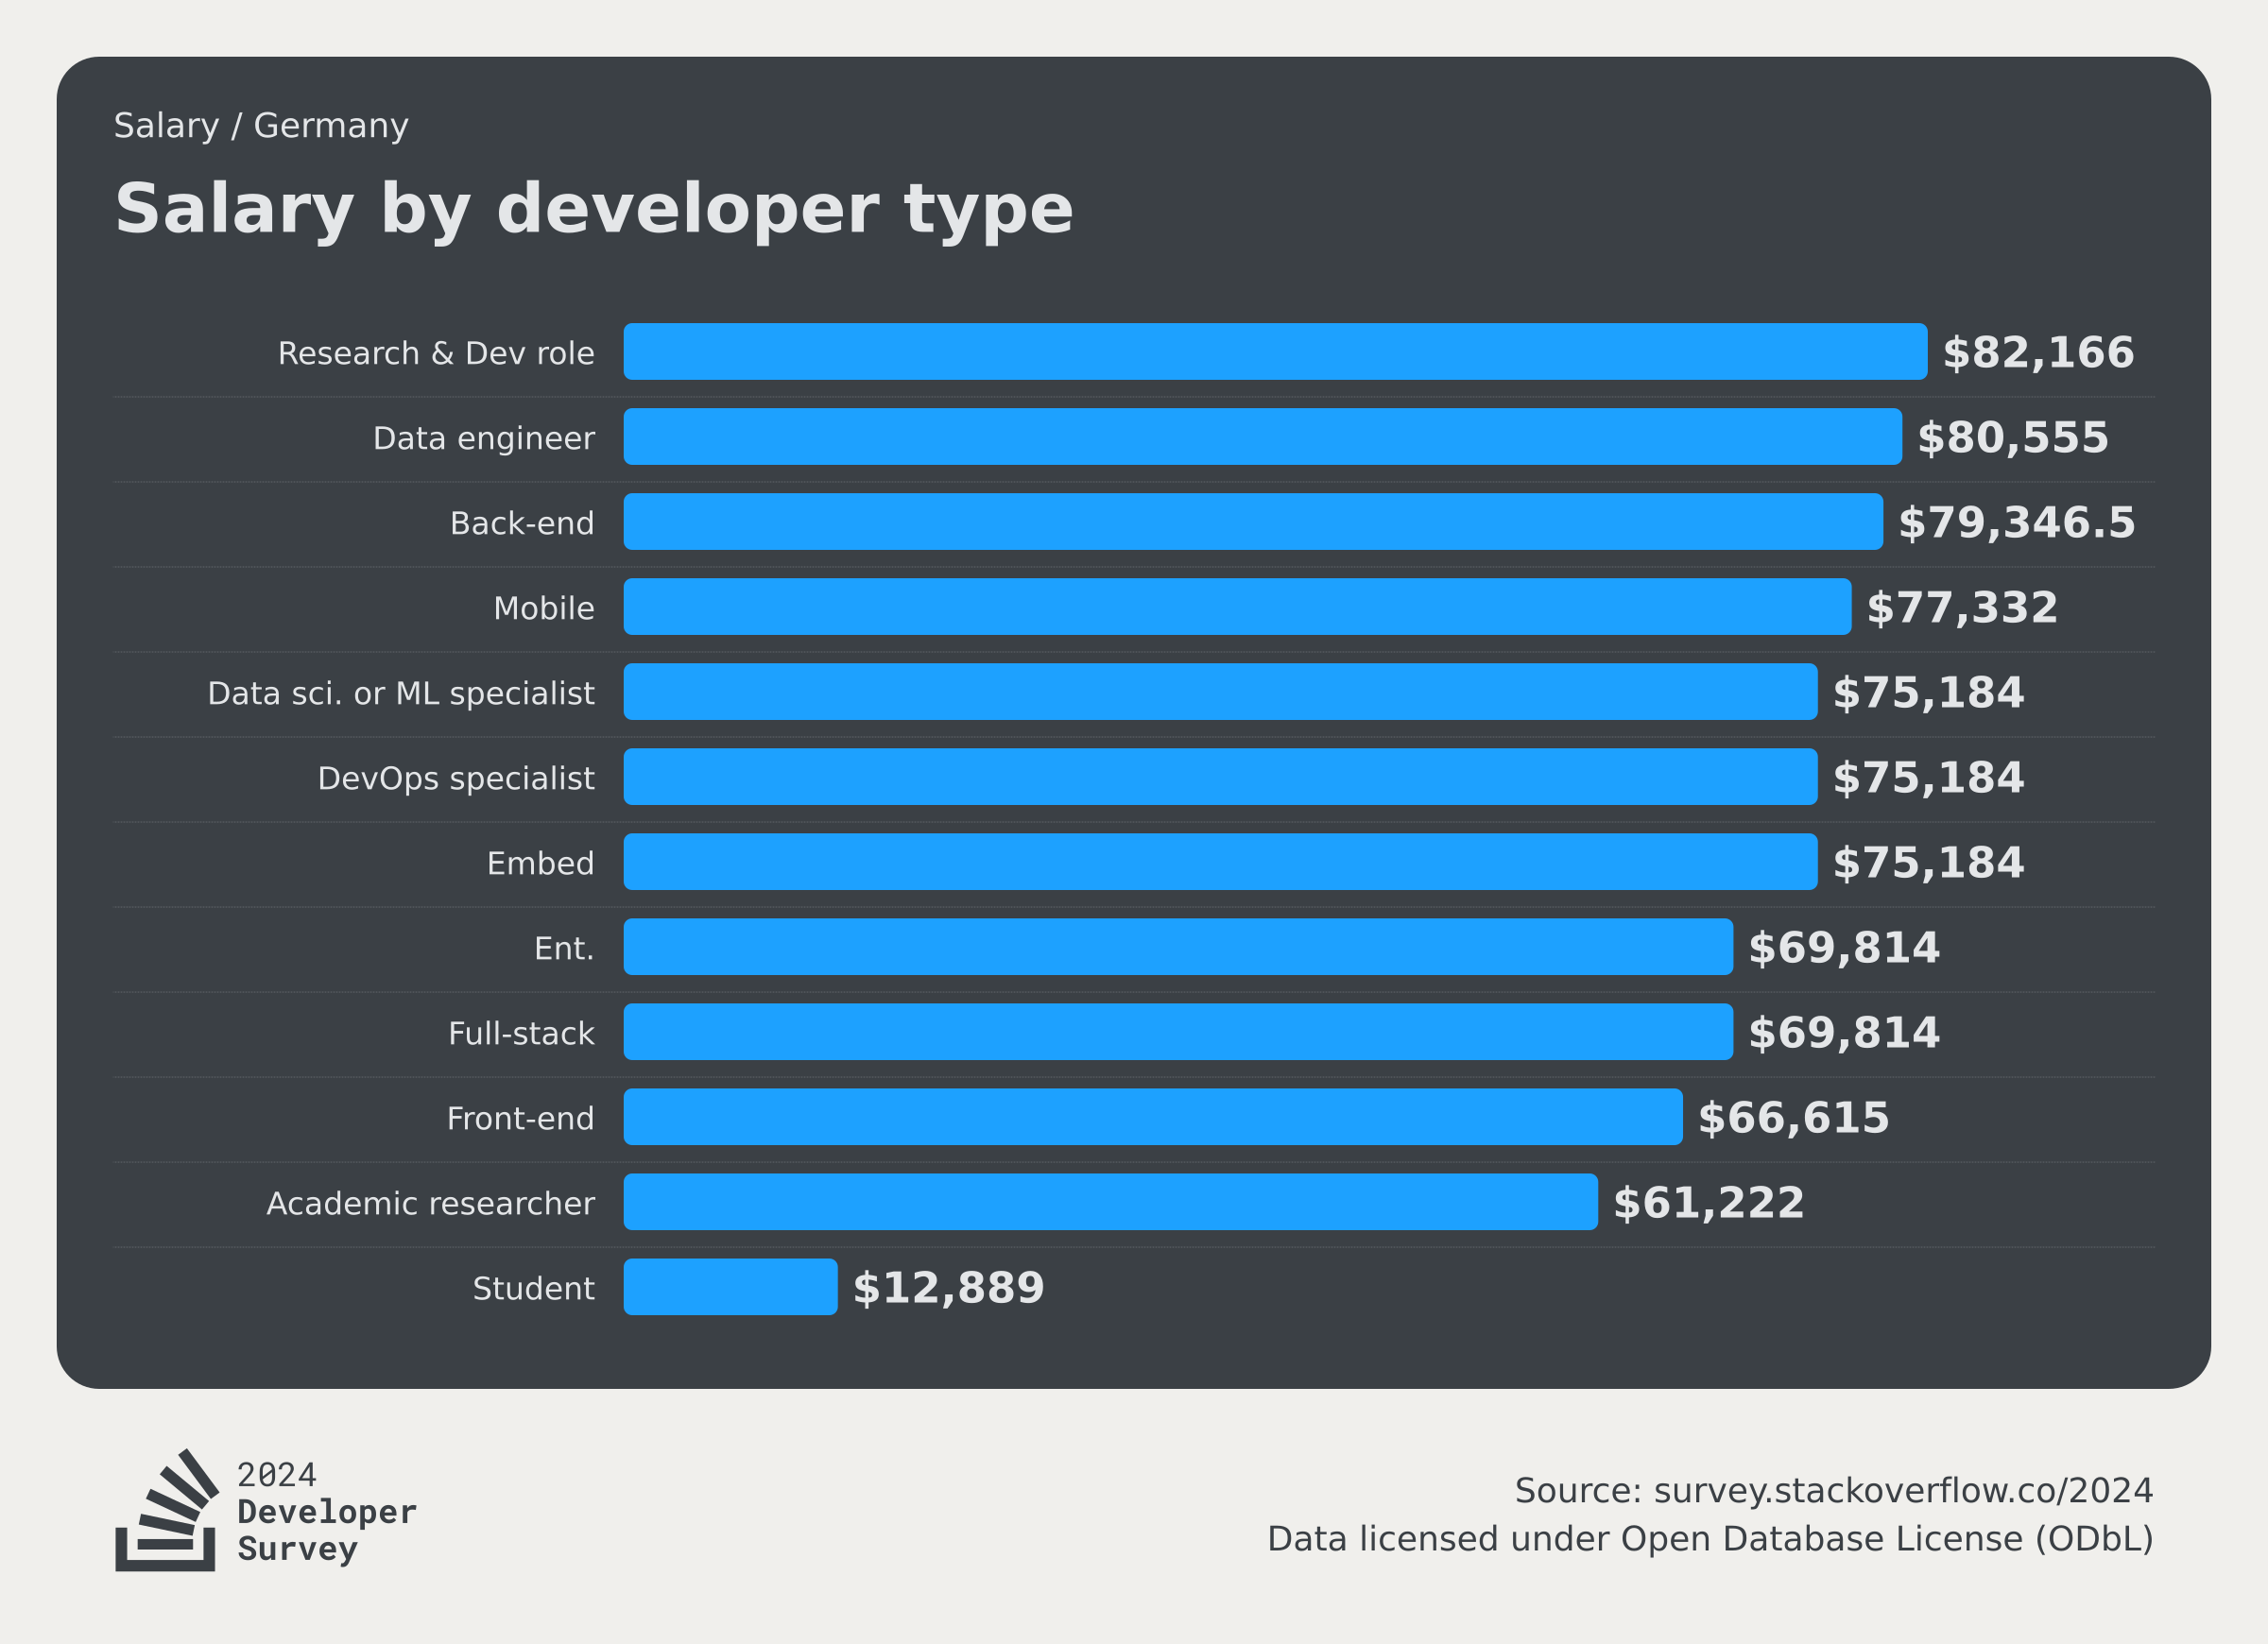
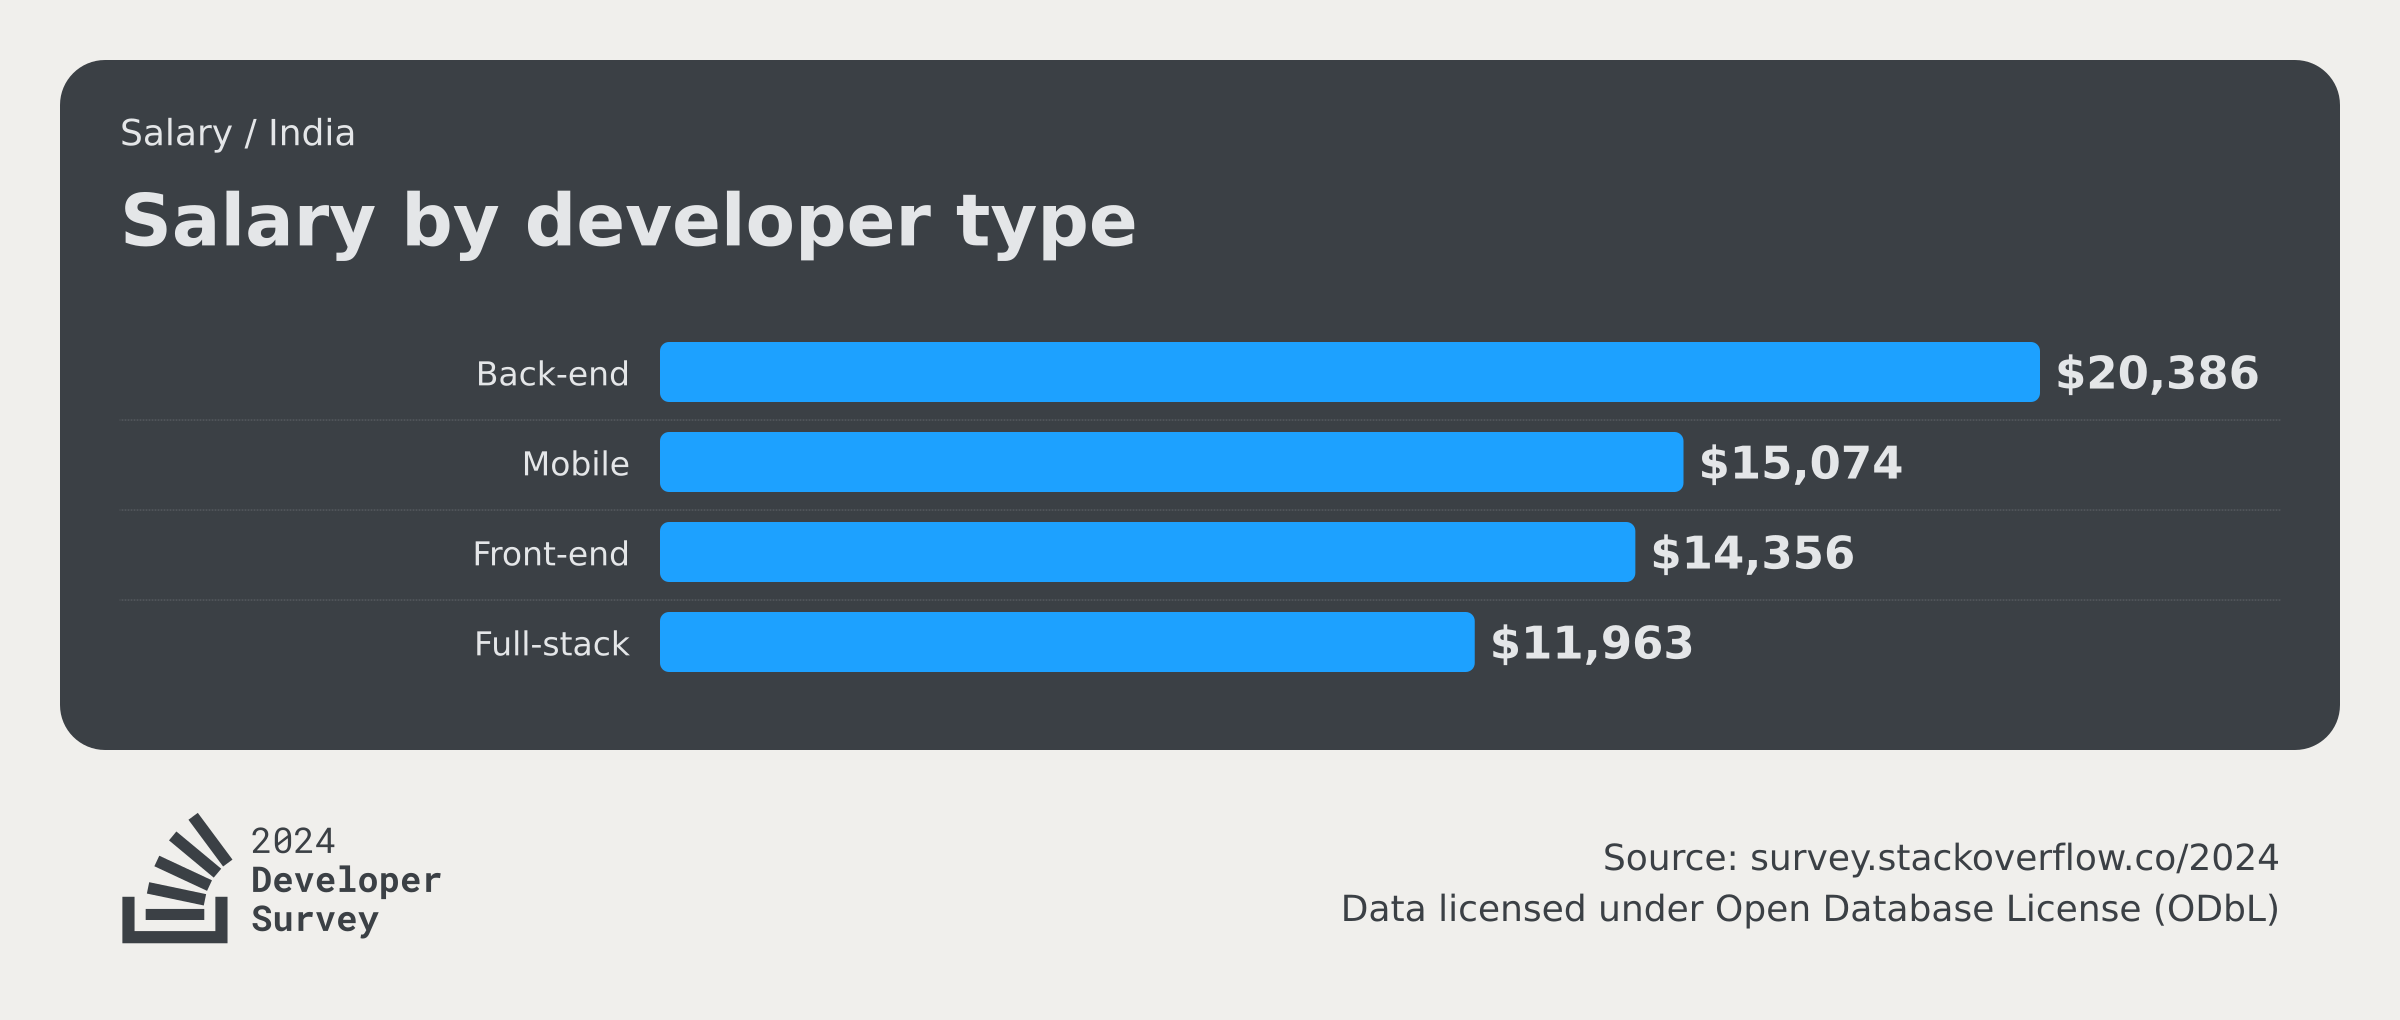
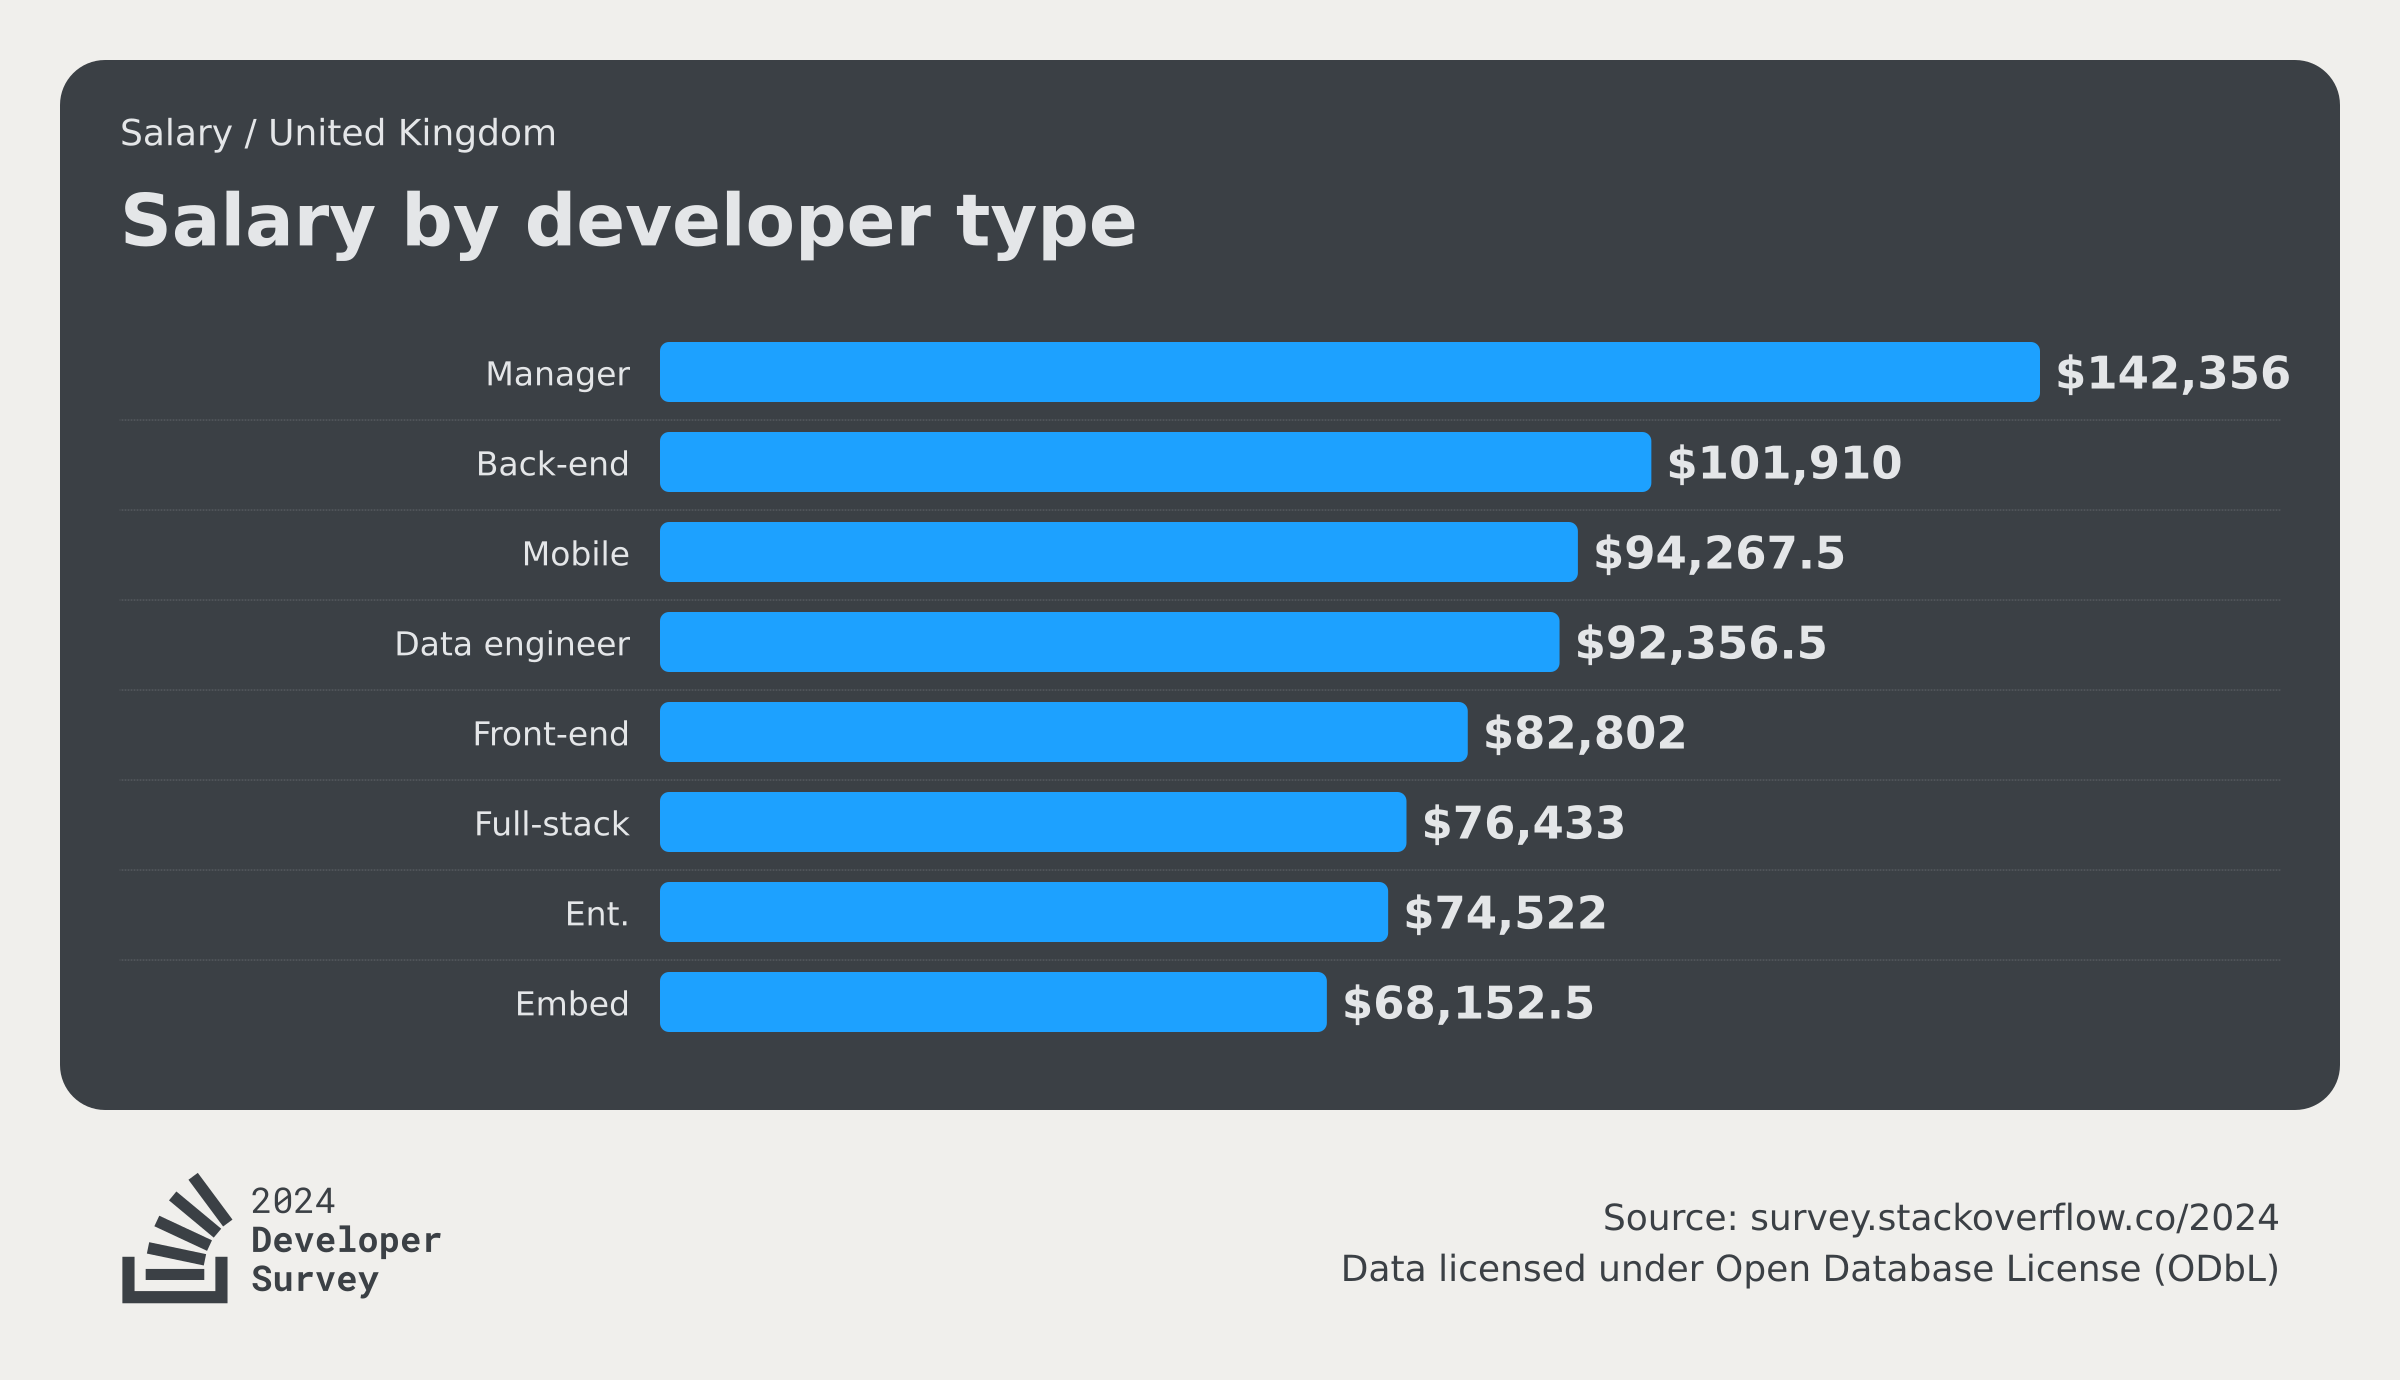
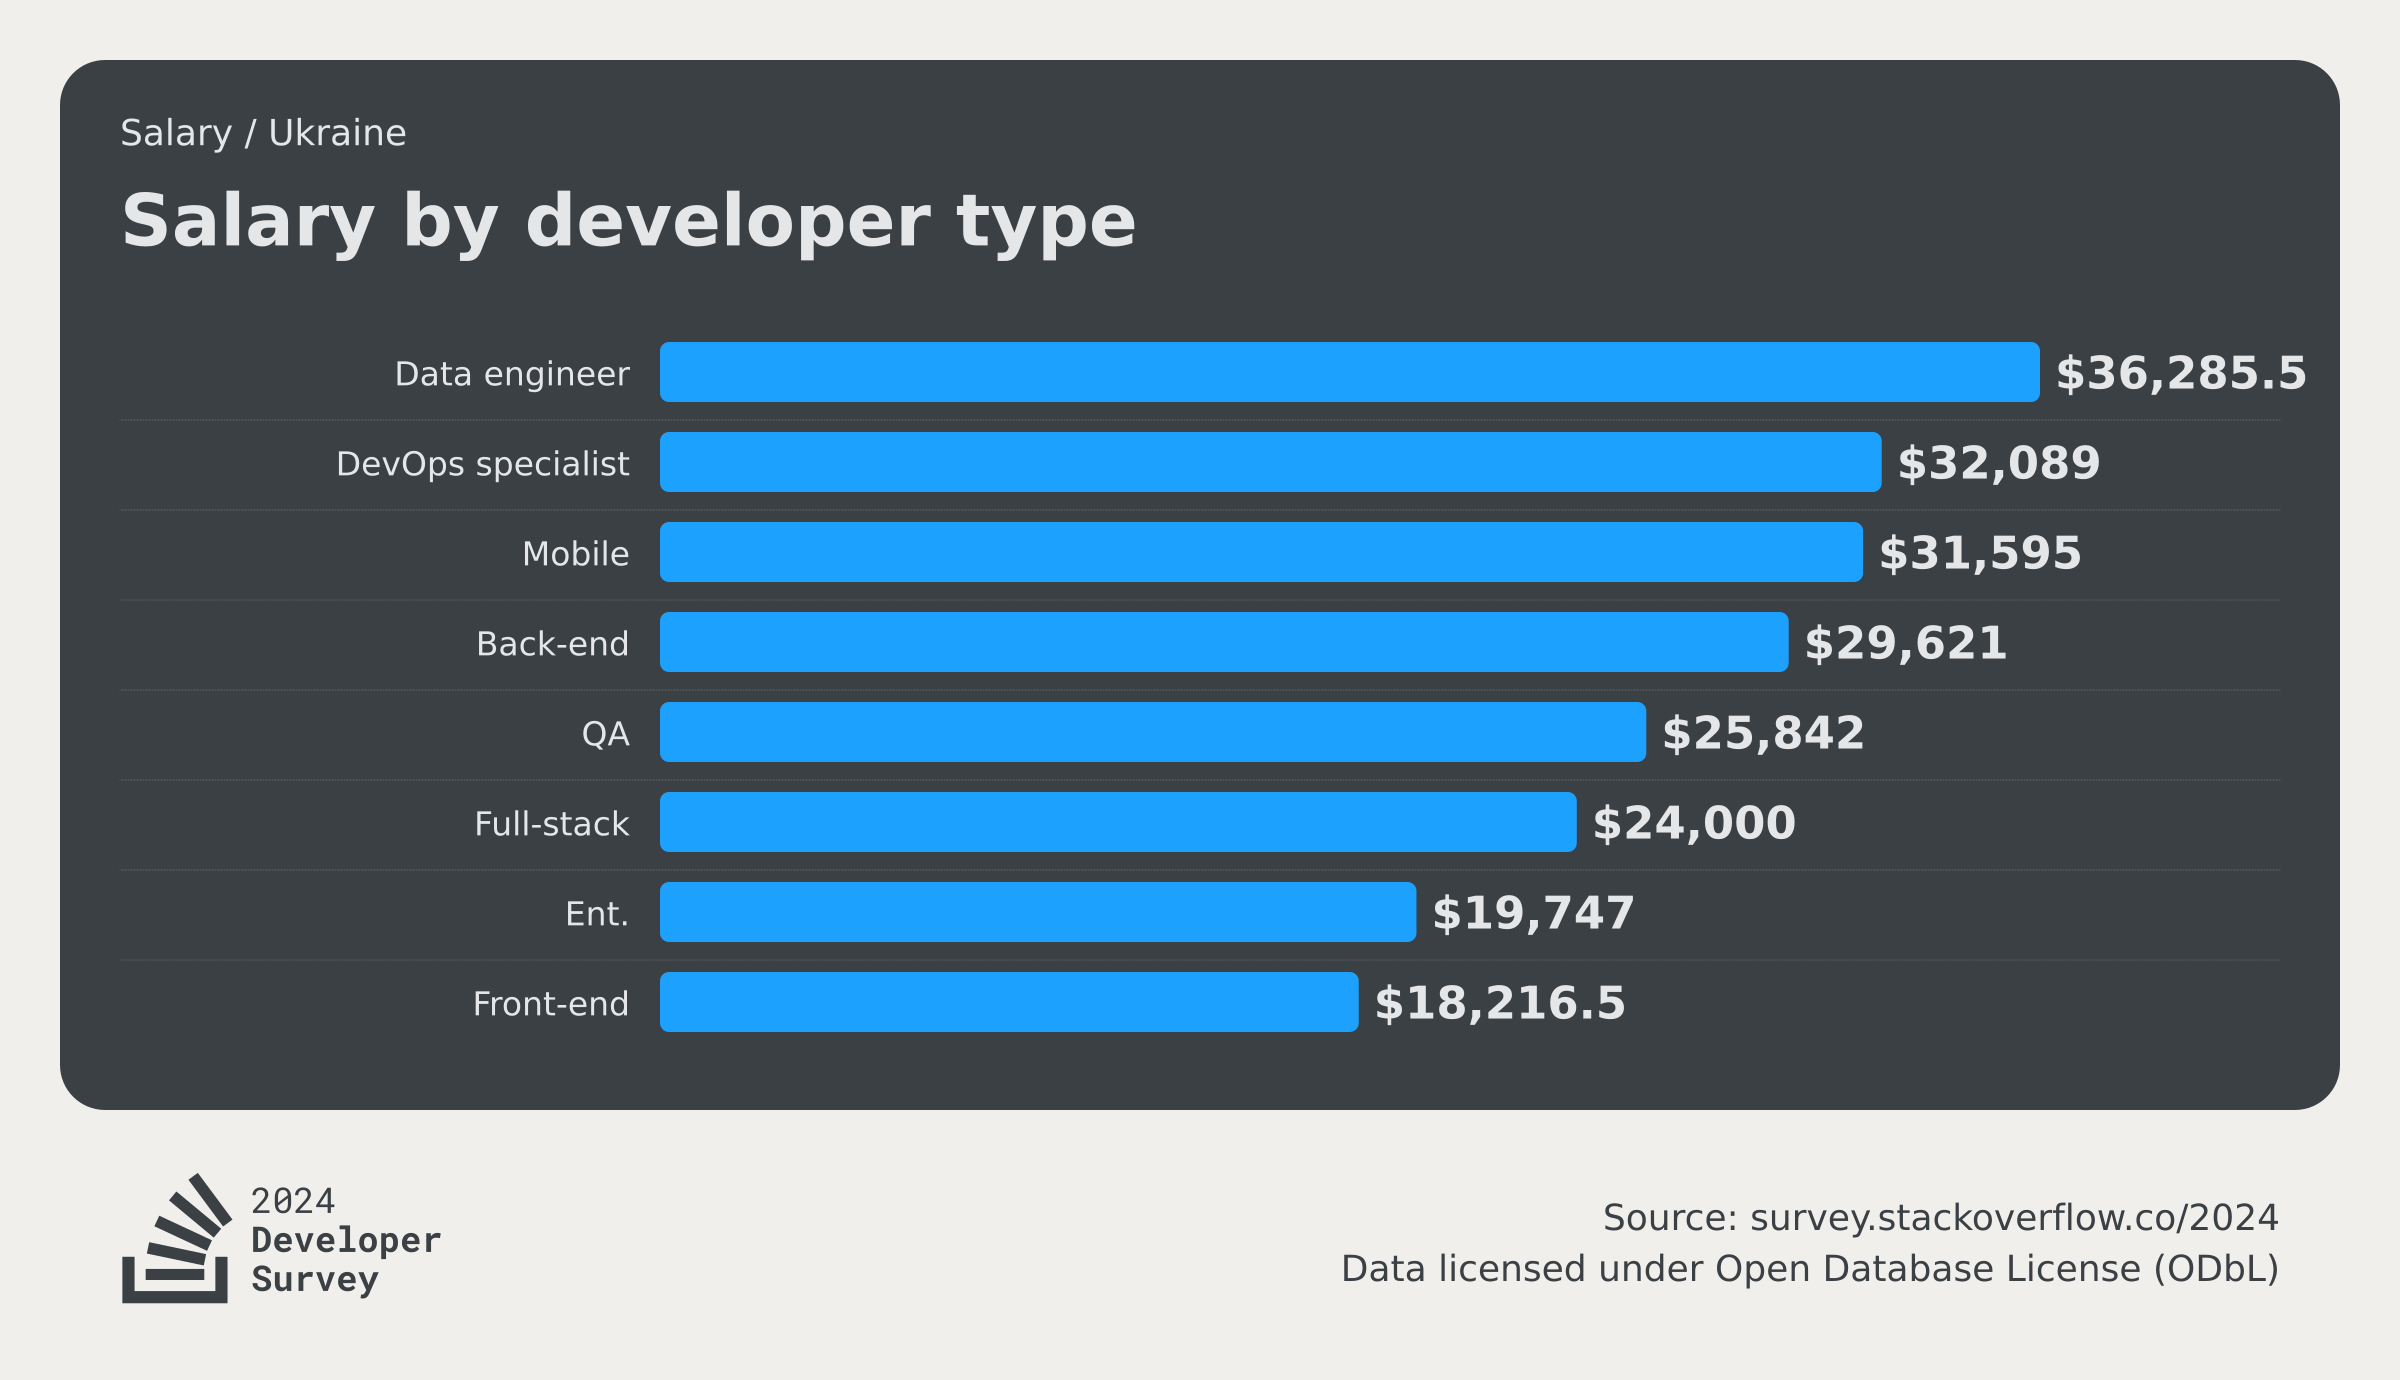
Looking at top-responding regions, mobile developers report higher earnings in the U.S., data engineers are the highest-paid in Germany and Ukraine, and back-end developers are top earners in India and the U.K.

What is your current total annual compensation (salary, bonuses, and perks, before taxes and deductions)? Please enter a whole number in the box below, without any punctuation. If you are paid hourly, please estimate an equivalent yearly salary. If you prefer not to answer, please leave the box empty.
All Respondents to-do Senior Executive $127,388Dev Advocate$124,203Manager$115,999.5Dev Experience$109,483SRE$99,099Cloud infra. engineer$96,666Blockchain$85,925Product manager$80,000Security pro.$78,995Hardware$76,206Data engineer$76,153.5Research & Dev role$75,184Sci.$75,000Data sci. or ML specialist$73,036DevOps specialist$72,611DB admin$71,561.5Embed$71,437.5Dev, AI$70,888Back-end$67,227Designer$67,097Ent.$63,647Full-stack$63,332.5Marketing or sales pro.$59,073PM$59,073Edu$58,728.5Games$55,000Data/Biz$54,507Mobile$54,340QA$54,178Sys$50,133Academic researcher$48,820Front-end$48,787Student$15,466
Responses: 22,677 (34.7%)
Median yearly salary in USD
United States to-do Senior Executive $225,000Manager$192,500Mobile$185,000Back-end$170,000SRE$166,500Cloud infra. engineer$165,000Dev, AI$160,000Data sci. or ML specialist$159,000Data engineer$150,000Research & Dev role$150,000DevOps specialist$145,000Ent.$135,000Front-end$135,000QA$130,000Embed$130,000Full-stack$130,000Security pro.$130,000Games$125,000Sci.$113,939.5Data/Biz$100,000Sys$83,080Academic researcher$62,000
Responses: 4,496 (6.9%)
Median yearly salary in USD
Germany to-do Research & Dev role$82,166Data engineer$80,555Back-end$79,346.5Mobile$77,332Data sci. or ML specialist$75,184DevOps specialist$75,184Embed$75,184Ent.$69,814Full-stack$69,814Front-end$66,615Academic researcher$61,222Student$12,889
Responses: 1,976 (3%)
Median yearly salary in USD
India to-do Back-end$20,386Mobile$15,074Front-end$14,356Full-stack$11,963
Responses: 1,011 (1.5%)
Median yearly salary in USD
United Kingdom to-do Manager$142,356Back-end$101,910Mobile$94,267.5Data engineer$92,356.5Front-end$82,802Full-stack$76,433Ent.$74,522Embed$68,152.5
Responses: 1,333 (2%)
Median yearly salary in USD
Ukraine to-do Data engineer$36,285.5DevOps specialist$32,089Mobile$31,595Back-end$29,621QA$25,842Full-stack$24,000Ent.$19,747Front-end$18,216.5
Responses: 1,436 (2.2%)
Median yearly salary in USD

Salary and experience by developer type

Developer experience is highly valued and this is confirmed by this year's top-earning roles that relate to the DevRel scaffolding. Senior executives are making the most with the most experience on average, followed by developer advocates, engineering managers, and developer experience professionals.

What is your current total annual compensation (salary, bonuses, and perks, before taxes and deductions)? Please enter a whole number in the box below, without any punctuation. If you are paid hourly, please estimate an equivalent yearly salary. If you prefer not to answer, please leave the box empty.
Salary and Experience by Developer Type to-do Number of responses 8,27652 Average years of professional experienceMedian yearly salary (USD) 2 4 6 8 10 12 14 16 18 $10,000 $20,000 $30,000 $40,000 $50,000 $60,000 $70,000 $80,000 $90,000 $100,000 $110,000 $120,000 $130,000Academic researcherBlockchainCloud infra. engineerData engineerData/BizData sci. or ML specialistDB adminDevOps specialistDev AdvocateDev ExperienceDev, AIQABack-endEnt.EmbedFront-endFull-stackGamesMobileEduSREManagerHardwareProduct managerPMResearch & Dev roleSci.Security pro.Senior Executive StudentSys
Responses: 22,677 (34.7%)

Salary and experience by language

Developers that are using Erlang and Clojure are top earners in the past year, averaging more than $95K annually (USD) with about 12 years experience. Developers working with Dart and Prolog are earning the least annually (< $45K annual USD) with less experience on average (< 10 years).

Most developers are reporting their salary range is averaging $10K USD less this year: $60 - $75K USD compared to $70 - $85K USD in 2023.

What is your current total annual compensation (salary, bonuses, and perks, before taxes and deductions)? Please enter a whole number in the box below, without any punctuation. If you are paid hourly, please estimate an equivalent yearly salary. If you prefer not to answer, please leave the box empty.
Salary and Experience by Language to-do Number of responses 14,341114 Average years of professional experienceMedian yearly salary (USD) 8 9 10 11 12 13 14 15 16 17 18 19 20 $40,000 $45,000 $50,000 $55,000 $60,000 $65,000 $70,000 $75,000 $80,000 $85,000 $90,000 $95,000 $100,000ErlangClojureElixirRubyPerlScalaF#LispApexGroovyOCamlZigRustGoBash/Shell MicroPythonSwiftLuaObjective-CPowerShellFortranCobolPYHaskellSolidityJuliaC#TSKotlinRSQLVBAC++Visual Basic CJSDelphiJavaHTML/CSSAssemblyGDScriptMATLABPHPDartProlog
Responses: 22,603 (34.5%)

4.4 Purchasing technology

Influence on technology purchases

Most respondents have influence over technology purchases (62%). Those roles with the highest levels of influence are senior executives (99%), engineering managers (87%), and product managers (77%).

What level of influence do you, personally, have over new technology purchases at your organization?
All Respondents to-do I have little or no influence37.9%I have some influence40.5%I have a great deal of influen…21.7%
Responses: 47,406 (72.4%)
By Developer Type to-do 1.8% 10.8% 87.5%Senior Executive (C-Suite, VP, etc.) 12.8% 46.9% 40.2%Engineering manager 22.6% 40.7% 36.7%Product manager 20% 43.8% 36.2%Project manager 27.5% 41.2% 31.3%Blockchain 27% 44% 29%Designer 33% 38.2% 28.8%Developer, game or graphics 30.2% 41.9% 27.9%Marketing or sales professional 28.1% 45.9% 26.1%System administrator 33.6% 40.8% 25.6%Developer, full-stack 31.8% 43.2% 25%Developer Advocate 29.5% 46% 24.6%Developer, AI 37.7% 39.6% 22.6%Hardware Engineer 35% 42.4% 22.6%Cloud infrastructure engineer 40.8% 36.6% 22.6%Educator 31.3% 46.8% 21.9%Research & Development role 32.2% 46.2% 21.6%Security professional 35.9% 44% 20.1%DevOps specialist 41.5% 39.4% 19.1%Engineer, site reliability 33.6% 47.8% 18.7%Database administrator 43.1% 38.3% 18.5%Developer, desktop or enterprise applications 37.1% 44.6% 18.4%Scientist 38.8% 43.2% 18%Developer, mobile 60.4% 22.9% 16.7%Student 43% 41.6% 15.4%Developer, embedded applications or devices 43.6% 41.6% 14.8%Academic researcher 43.8% 41.8% 14.5%Data engineer 40.9% 44.7% 14.4%Data scientist or machine learning specialist 43% 43% 14%Developer Experience 46.6% 40.1% 13.4%Developer, back-end 44.4% 42.3% 13.3%Developer, front-end 55.5% 31.3% 13.2%Data or business analyst 57.8% 35.2% 7%Developer, QA or testI have little or no influenceI have some influenceI have a great deal of influence
Responses: 45,922 (70.2%)

Prefer to build and/or buy new tech

60% of respondents endorse technology purchases that are build-and-buy as opposed to purely build or buy. Database administrators, developer advocates, and security professionals are less likely to endorse a build-and-buy approach possibly due to the need to document and safeguard customizations.

When asked to provide a recommendation for solving a problem at work with a new tool or software, what has been your most recent choice of the following?
All Respondents to-do Build and Buy59.9%Build20.2%Buy19.9%
Responses: 43,358 (66.3%)
By Developer Type to-do 65.3% 14% 20.7%Student 63.5% 21.9% 14.6%Cloud infrastructure engineer 63.3% 22.4% 14.3%DevOps specialist 63% 16.7% 20.4%Developer, front-end 62.7% 16% 21.3%Developer, QA or test 62.4% 19.6% 18.1%Project manager 61.6% 23.3% 15.2%Data engineer 61.4% 21.5% 17.1%System administrator 61.3% 23.8% 14.9%Engineer, site reliability 60.9% 16.9% 22.2%Educator 60.8% 19.8% 19.5%Developer, full-stack 60.3% 21.8% 17.9%Senior Executive (C-Suite, VP, etc.) 59.9% 24.1% 16%Developer, embedded applications or devices 59.8% 20.8% 19.4%Engineering manager 59.7% 18.8% 21.5%Developer, back-end 59.5% 19.1% 21.4%Marketing or sales professional 59.1% 19.9% 21.1%Developer, game or graphics 59% 25.4% 15.6%Data scientist or machine learning specialist 58.3% 19.1% 22.6%Blockchain 58.2% 19.8% 22%Designer 57.9% 20.9% 21.2%Data or business analyst 57.8% 23.7% 18.5%Developer, AI 57% 18% 25%Developer Experience 56.5% 16.7% 26.8%Developer, mobile 56.3% 20.4% 23.3%Developer, desktop or enterprise applications 56% 28.7% 15.3%Hardware Engineer 55.6% 28.1% 16.3%Research & Development role 55.3% 26.4% 18.3%Scientist 55.1% 20.1% 24.7%Product manager 55.1% 24.6% 20.3%Academic researcher 53.3% 26.4% 20.3%Security professional 48.8% 17.1% 34.2%Developer Advocate 48.5% 26.9% 24.6%Database administratorBuild and BuyBuildBuy
Responses: 42,016 (64.2%)

Researching new tools and technologies

Starting a free trial is the most common way to evaluate new tools (75%) followed closely by asking other developers (73%).

Backend developers, embedded app developers, and academic researchers prefer to ask other developers than to start a free trial.

When buying a new tool or software, how do you discover and research available solutions? Select all that apply.
All Respondents to-do Start a free trial75.2%Ask developers I know/work wit…72.5%Visit dev communities like Sta…61.3%Read ratings or reviews on thi…31.2%Ask a generative AI tool18.8%Research companies that have a…13.8%Research companies that have e…5%
Responses: 45,181 (69%)
Academic researcherAcademic researcher No description Start a free trial61.2%Ask developers I know/work wit…69.2%Visit dev communities like Sta…60.7%Read ratings or reviews on thi…25.8%Ask a generative AI tool14%Research companies that have a…11.4%Research companies that have e…3.9% Data engineerData engineer No description Start a free trial73.7%Ask developers I know/work wit…73.1%Visit dev communities like Sta…63.4%Read ratings or reviews on thi…30.1%Ask a generative AI tool20.4%Research companies that have a…14.8%Research companies that have e…6.8% Data scientist or machine learning specialistData scientist or machine learning specialist No description Start a free trial71.6%Ask developers I know/work wit…69.9%Visit dev communities like Sta…60.9%Read ratings or reviews on thi…26.8%Ask a generative AI tool21%Research companies that have a…13.9%Research companies that have e…7% Developer, back-endDeveloper, back-end No description Start a free trial75%Ask developers I know/work wit…76%Visit dev communities like Sta…59.1%Read ratings or reviews on thi…29.5%Ask a generative AI tool18.5%Research companies that have a…11.6%Research companies that have e…3.6% Developer, desktop or enterprise applicationsDeveloper, desktop or enterprise applications No description Start a free trial76.6%Ask developers I know/work wit…70%Visit dev communities like Sta…65.8%Read ratings or reviews on thi…30.7%Ask a generative AI tool13%Research companies that have a…13.2%Research companies that have e…4.8% Developer, embedded applications or devicesDeveloper, embedded applications or devices No description Start a free trial69.8%Ask developers I know/work wit…76.6%Visit dev communities like Sta…66%Read ratings or reviews on thi…27%Ask a generative AI tool13.5%Research companies that have a…12.4%Research companies that have e…4.7% Developer, front-endDeveloper, front-end No description Start a free trial73.7%Ask developers I know/work wit…72.8%Visit dev communities like Sta…57%Read ratings or reviews on thi…30.6%Ask a generative AI tool20.9%Research companies that have a…12%Research companies that have e…3.3% Developer, full-stackDeveloper, full-stack No description Start a free trial77.3%Ask developers I know/work wit…71.4%Visit dev communities like Sta…63.2%Read ratings or reviews on thi…32.3%Ask a generative AI tool19.6%Research companies that have a…13.9%Research companies that have e…4.6% Developer, mobileDeveloper, mobile No description Start a free trial76.1%Ask developers I know/work wit…71.8%Visit dev communities like Sta…57.5%Read ratings or reviews on thi…29.5%Ask a generative AI tool20.6%Research companies that have a…13.9%Research companies that have e…3.6% Engineering managerEngineering manager No description Start a free trial83.6%Ask developers I know/work wit…79.2%Visit dev communities like Sta…56.2%Read ratings or reviews on thi…32.3%Ask a generative AI tool20.6%Research companies that have a…19%Research companies that have e…8.5%
Responses: 36,083 (55.1%)

Tech endorsement factors

APIs are pretty cool, but did you know that 75% of developers are more likely to endorse your technology if you provide access to APIs? Make sure to let back-end developers and engineering managers know about the API integrations you offer: they are even more likely to endorse your tech than the average coder.

What product feature do you care about most when endorsing a technology purchase? Select all that apply.
All Respondents to-do APIs75.2%Reputation for quality and exc…71%Customization59.9%Connected to an open source pr…41.5%Integrated dev community41.1%Frequent updates to features40.5%Quality support system39.1%AI tool integration5.9%
Responses: 43,668 (66.7%)
Academic researcherAcademic researcher No description APIs61.8%Reputation for quality and exc…70%Customization56.8%Connected to an open source pr…64.5%Integrated dev community33%Frequent updates to features29.2%Quality support system26.5%AI tool integration5.2% Data engineerData engineer No description APIs71.3%Reputation for quality and exc…74.4%Customization59.7%Connected to an open source pr…46.1%Integrated dev community45.3%Frequent updates to features39.5%Quality support system41.3%AI tool integration6.7% Data scientist or machine learning specialistData scientist or machine learning specialist No description APIs74.5%Reputation for quality and exc…72.9%Customization55.3%Connected to an open source pr…50.3%Integrated dev community41.7%Frequent updates to features35.7%Quality support system36.9%AI tool integration10.7% Developer, back-endDeveloper, back-end No description APIs79.7%Reputation for quality and exc…72.1%Customization56.9%Connected to an open source pr…42.4%Integrated dev community42.2%Frequent updates to features39.6%Quality support system37.5%AI tool integration5.3% Developer, desktop or enterprise applicationsDeveloper, desktop or enterprise applications No description APIs73.4%Reputation for quality and exc…71.7%Customization57.8%Connected to an open source pr…32.9%Integrated dev community36.8%Frequent updates to features37.4%Quality support system39.7%AI tool integration3.6% Developer, embedded applications or devicesDeveloper, embedded applications or devices No description APIs65.4%Reputation for quality and exc…71.3%Customization54.2%Connected to an open source pr…46.3%Integrated dev community34.6%Frequent updates to features29.7%Quality support system38.9%AI tool integration2.3% Developer, front-endDeveloper, front-end No description APIs71.4%Reputation for quality and exc…68.4%Customization66.1%Connected to an open source pr…36.5%Integrated dev community49.4%Frequent updates to features46.9%Quality support system41.7%AI tool integration6.9% Developer, full-stackDeveloper, full-stack No description APIs78.6%Reputation for quality and exc…70.8%Customization63.4%Connected to an open source pr…40.2%Integrated dev community42.8%Frequent updates to features43.5%Quality support system39.1%AI tool integration5.7% Developer, mobileDeveloper, mobile No description APIs74.7%Reputation for quality and exc…69.6%Customization58.1%Connected to an open source pr…32.2%Integrated dev community46.9%Frequent updates to features49%Quality support system45.9%AI tool integration9.1% Engineering managerEngineering manager No description APIs80.8%Reputation for quality and exc…78%Customization58.3%Connected to an open source pr…38.3%Integrated dev community39.7%Frequent updates to features41.7%Quality support system45%AI tool integration5.6%
Responses: 34,541 (52.8%)

4.5 Coding outside of work

Coding outside of work

Most developers code outside of work as a hobby (68%), and almost 40% code outside of work for professional development or self-paced learning from online courses.

Which of the following best describes the code you write outside of work? Select all that apply.
All Respondents to-do Hobby68.3%Pro. dev or self-paced learnin…39.5%Contribute to open-source proj…25.2%Freelance/contract work19.3%Bootstrapping a business15%School or academic work13%I don’t code outside of work11.9%
Responses: 54,466 (83.2%)