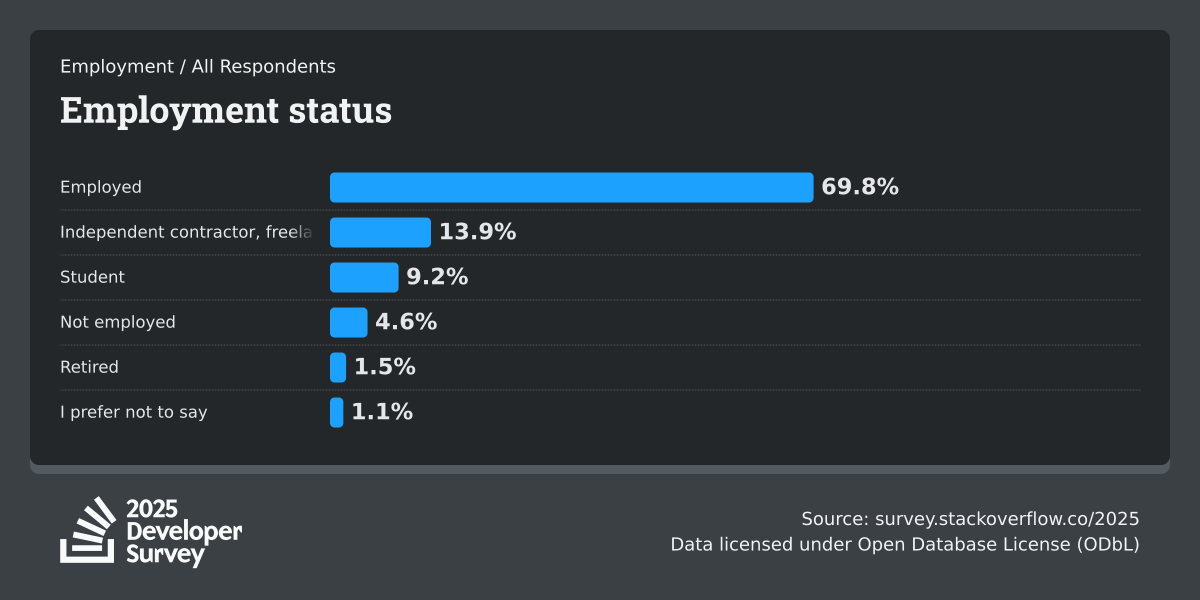
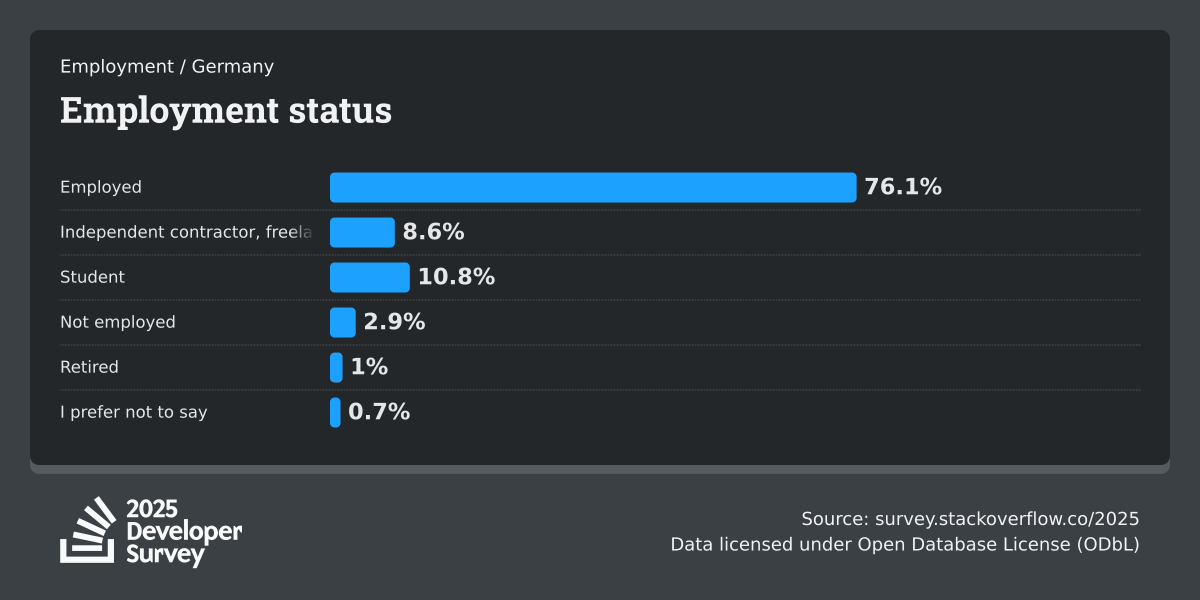
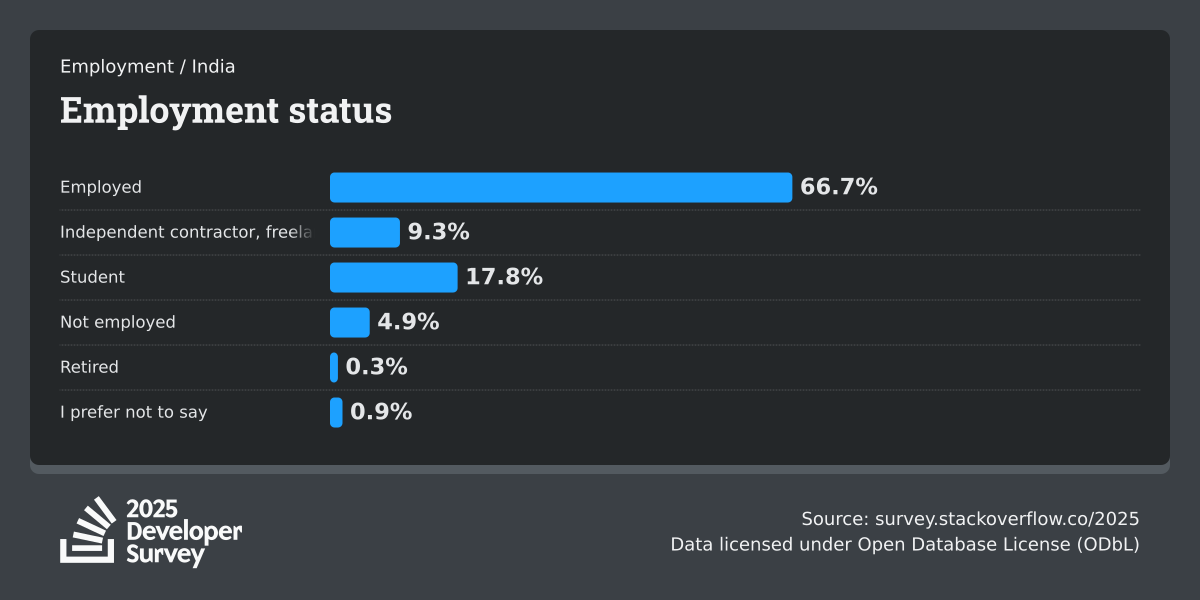
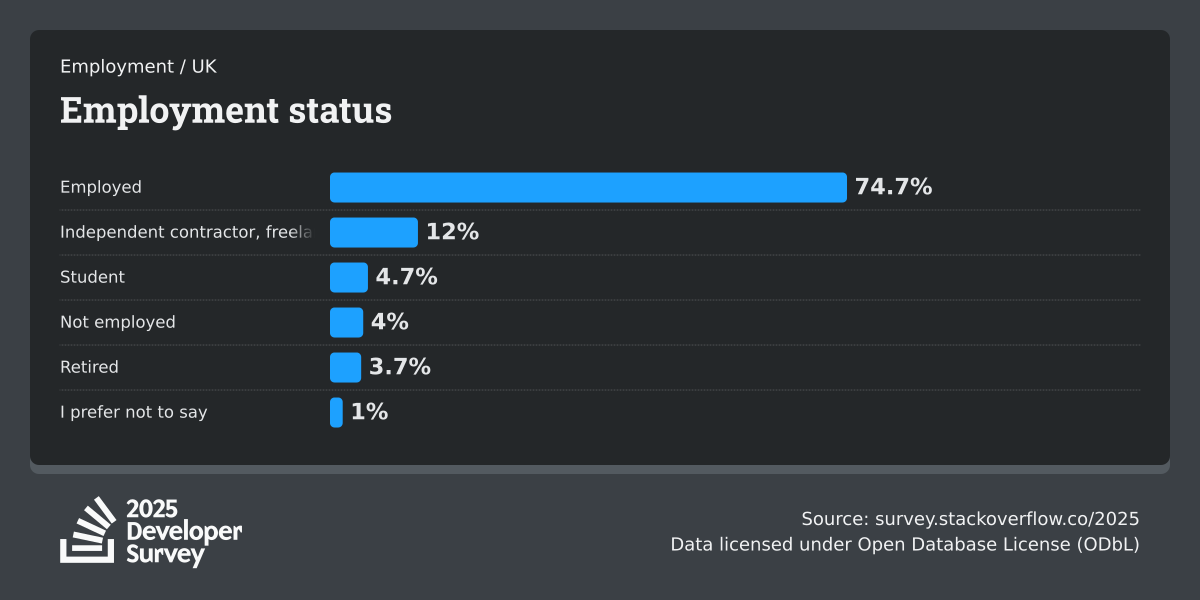
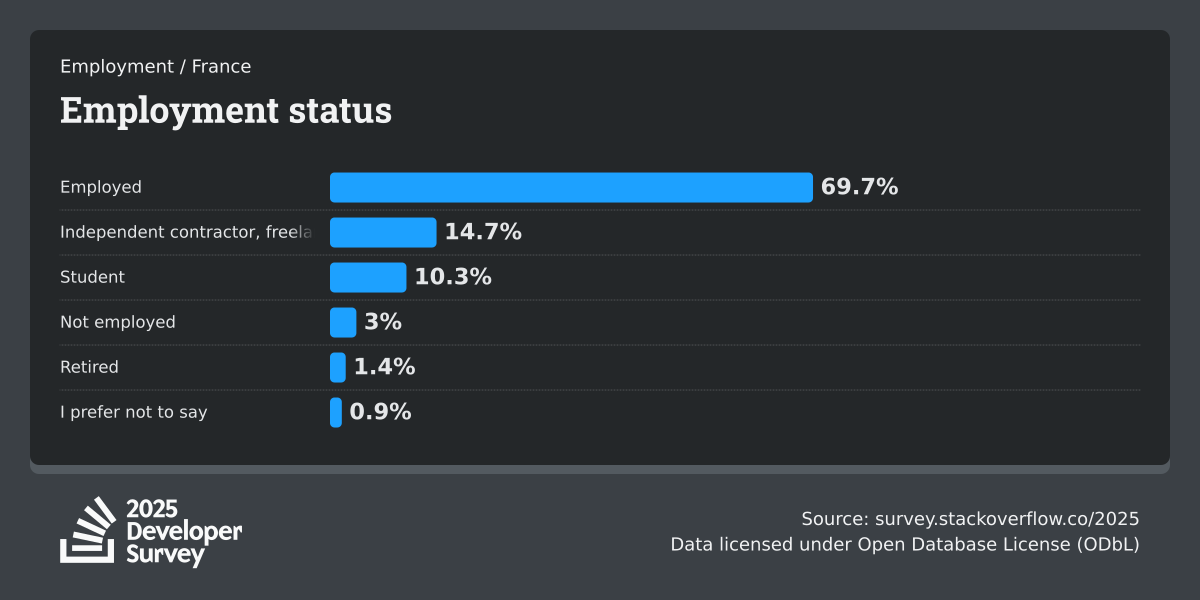
Stack Overflow Developer Survey 2025

4 Work

Developers tell us about workplace trends and offer some transparency about salary for different roles and experience levels.

4.1 Employment

Employment status

It's difficult to say whether one is connected to the other, but developers who fill out the Developer Survey are 70% likely to be employed. The employment rate has remained a consistent result in Stack Overflow surveys in recent years. This year we show you geographic differences among the top 5 responding countries: Germany (76%) and the UK (75%) show the highest rates of formal employment. India has a significantly larger student population (18%) among its respondents compared to the US (6%), Germany (11%), and the UK (5%).

Which of the following best describes your current employment status?
All RespondentsEmployed69.8%Independent contractor, freelancer, or self-employed13.9%Student9.2%Not employed4.6%Retired1.5%I prefer not to say1.1%
Responses: 48,178(98.3%)
USAEmployed74.8%Independent contractor, freelancer, or self-employed10%Student5.6%Not employed5.6%Retired3%I prefer not to say1%
Responses: 7,218(14.7%)
GermanyEmployed76.1%Independent contractor, freelancer, or self-employed8.6%Student10.8%Not employed2.9%Retired1%I prefer not to say0.7%
Responses: 3,022(6.2%)
IndiaEmployed66.7%Independent contractor, freelancer, or self-employed9.3%Student17.8%Not employed4.9%Retired0.3%I prefer not to say0.9%
Responses: 2,536(5.2%)
UKEmployed74.7%Independent contractor, freelancer, or self-employed12%Student4.7%Not employed4%Retired3.7%I prefer not to say1%
Responses: 2,036(4.2%)
FranceEmployed69.7%Independent contractor, freelancer, or self-employed14.7%Student10.3%Not employed3%Retired1.4%I prefer not to say0.9%
Responses: 1,408(2.9%)

Employment additional status

Developers self-employed or not working currently engage in the same amount of volunteer work. Both groups indicate 12% do volunteer work in addition to their employment status.

Which of the following additional activities are you currently engaged in?
All RespondentsNone of the above42.2%Caring for dependents (children, elderly, etc.)18.5%Engaged in paid work (20-29 hours per week)15.7%Volunteering (regularly)12.3%Attending school (full-time)9.8%Engaged in paid work (less than 10 hours per week)7.7%Attending school (part-time)6.1%Engaged in paid work (10-19 hours per week)4.3%Transitioning to retirement (gradually reducing work hours)2.1%
Responses: 44,733(91.3%)
EmployedEngaged in paid work (20-29 hours per week)13.8%None of the above41.7%Attending school (part-time)4.7%Transitioning to retirement (gradually reducing work hours)0.9%Caring for dependents (children, elderly, etc.)18.1%Engaged in paid work (less than 10 hours per week)5.7%Attending school (full-time)2.5%Volunteering (regularly)9.8%Engaged in paid work (10-19 hours per week)2.7%
Responses: 35,841(73.1%)
Self-EmployedEngaged in paid work (20-29 hours per week)19.1%None of the above25.1%Attending school (part-time)4.6%Transitioning to retirement (gradually reducing work hours)5.1%Caring for dependents (children, elderly, etc.)15.9%Engaged in paid work (less than 10 hours per week)8.6%Attending school (full-time)3.3%Volunteering (regularly)12%Engaged in paid work (10-19 hours per week)6.2%
Responses: 8,126(16.6%)
StudentEngaged in paid work (20-29 hours per week)7.4%None of the above6.5%Attending school (part-time)8%Transitioning to retirement (gradually reducing work hours)0.5%Caring for dependents (children, elderly, etc.)1.6%Engaged in paid work (less than 10 hours per week)8.7%Attending school (full-time)52.8%Volunteering (regularly)8.4%Engaged in paid work (10-19 hours per week)6.1%
Responses: 5,823(11.9%)
Not EmployedEngaged in paid work (20-29 hours per week)3.7%None of the above49.4%Attending school (part-time)7.3%Transitioning to retirement (gradually reducing work hours)1.7%Caring for dependents (children, elderly, etc.)11.6%Engaged in paid work (less than 10 hours per week)5.7%Attending school (full-time)5.6%Volunteering (regularly)12.2%Engaged in paid work (10-19 hours per week)2.9%
Responses: 2,433(5%)

Work environment

Of the top-reporting countries in this year's survey, the US has the highest number of developers working remotely (45%). 21% of developers in Germany say the choice to go into the office or work remotely is completely up to them.

Which best describes your current work situation?
All RespondentsRemote32.4%Your choice (very flexible, you can come in when you want or just as needed)12.6%In-person17.9%Hybrid (some remote, leans heavy to in-person)19.9%Hybrid (some in-person, leans heavy to flexibility)17.2%
Responses: 33,686(68.7%)
USARemote45%Your choice (very flexible, you can come in when you want or just as needed)9.2%In-person16.2%Hybrid (some remote, leans heavy to in-person)16.7%Hybrid (some in-person, leans heavy to flexibility)12.9%
Responses: 5,848(11.9%)
GermanyRemote22.5%Your choice (very flexible, you can come in when you want or just as needed)20.7%In-person10.5%Hybrid (some remote, leans heavy to in-person)21.6%Hybrid (some in-person, leans heavy to flexibility)24.6%
Responses: 2,531(5.2%)
IndiaRemote25.6%Your choice (very flexible, you can come in when you want or just as needed)7.1%In-person30.5%Hybrid (some remote, leans heavy to in-person)23.1%Hybrid (some in-person, leans heavy to flexibility)13.7%
Responses: 1,855(3.8%)
UKRemote31.9%Your choice (very flexible, you can come in when you want or just as needed)14%In-person11.4%Hybrid (some remote, leans heavy to in-person)16.9%Hybrid (some in-person, leans heavy to flexibility)25.8%
Responses: 1,644(3.4%)
FranceRemote18.1%Your choice (very flexible, you can come in when you want or just as needed)12%In-person16.9%Hybrid (some remote, leans heavy to in-person)32.8%Hybrid (some in-person, leans heavy to flexibility)20.2%
Responses: 1,083(2.2%)

IC or PM

There are a few more managers in this year's results: 15% indicate being a people manager this year compared to 13% last year, most likely reflecting the growing number of more experienced respondents in this year's survey.

Are you an individual contributor or people manager?
Unknow graphIndividual contributor85.3%People manager14.7%
Responses: 33,154(67.6%)

4.2 Company info

Company size

Of respondents who identicated they were currently employed, 57% said they work for companies with fewer than 500 employees.

Approximately how many people are employed by your employer? This should only include your primary company, and if there was more than one employer please consider the one you spent most of your time working for in the past year.
All RespondentsJust me - I am a freelancer, sole proprietor, etc.3.9%Less than 20 employees17.2%20 to 99 employees20.8%100 to 499 employees18.5%500 to 999 employees7%1,000 to 4,999 employees11.8%5,000 to 9,999 employees4.4%10,000 or more employees14.2%I don’t know2.1%
Responses: 28,488(58.1%)

4.3 Salary

Salary by developer type

Senior Executives ($139k), Engineering Managers ($130k), and Financial Analysts ($104k) have the highest median annual salaries globally.

The salary gap between the US and other countries is wide for higher paid roles. The median salary for an Engineering Manager in the US is $200,000, compared to $118,000 in Germany and just $52,000 in India.

What is your current total annual compensation (salary, bonuses, and perks, before taxes and deductions) in terms of your day-to-day currency? Please enter a whole number in the box below, without any punctuation. If you are paid hourly, please estimate an equivalent yearly salary. If you prefer not to answer, please leave the box empty.
All RespondentsSenior executive (C-suite, VP, etc.)$139,218Engineering manager$130,000Financial analyst or engineer$103,757Cloud infrastructure engineer$103,112.5Architect, software or solutions$102,000Product manager$100,000Applied scientist$96,945.5Cybersecurity or InfoSec professional$96,146Founder, technology or otherwise$92,786AI/ML engineer$89,427DevOps engineer or professional$87,011Database administrator or engineer$85,168.5Data scientist$82,910Data engineer$81,210Developer, embedded applications or devices$81,210Developer, back-end$79,742Developer, desktop or enterprise applications$72,958Developer, full-stack$72,509Developer, game or graphics$70,794Developer, mobile$69,609Project manager$68,924Developer, AI apps or physical AI$62,767Support engineer or analyst$62,648Data or business analyst$62,625Developer, front-end$62,015Other (please specify):$61,024UX, Research Ops or UI design professional$60,000Developer, QA or test$57,442.5Academic researcher$57,179System administrator$55,148Retired$40,605Student$12,253
Responses: 23,928(48.8%)
Median yearly salary in USD
Compare to 2024Product manager29.3%Applied scientist28.9%Developer, game or graphics28.7%Developer, mobile27.1%Developer, front-end24%Database administrator or engineer19%Project manager16.7%DevOps engineer or professional16.2%Developer, back-end15.1%Academic researcher15.1%Data or business analyst13.2%Developer, desktop or enterprise applications13.2%Developer, embedded applications or devices12.8%Developer, full-stack12.5%Data scientist11.8%Engineering manager10.8%Developer, QA or test8.4%System administrator8.3%Cloud infrastructure engineer6.7%Data engineer5.1%
Responses: 23,928(48.8%)
Percent change in median yearly salary from 2024 to 2025
United StatesSenior executive (C-suite, VP, etc.)$225,000Engineering manager$200,000AI/ML engineer$189,500Cloud infrastructure engineer$189,000Architect, software or solutions$180,000Developer, back-end$175,000Developer, mobile$170,000DevOps engineer or professional$165,000Applied scientist$157,500Cybersecurity or InfoSec professional$150,000Data engineer$150,000Data scientist$145,000Developer, front-end$145,000Developer, full-stack$138,000Developer, embedded applications or devices$132,500Developer, desktop or enterprise applications$128,000Data or business analyst$100,956Other (please specify):$100,000System administrator$83,000Academic researcher$82,300Student$32,000
Responses: 5,239(10.7%)
Median yearly salary in USD
GermanyEngineering manager$118,335Project manager$110,214Architect, software or solutions$109,054Cloud infrastructure engineer$98,612Developer, mobile$93,972Cybersecurity or InfoSec professional$92,812Data engineer$92,812Data scientist$92,812Applied scientist$88,751DevOps engineer or professional$87,011Developer, back-end$87,011Other (please specify):$87,011Developer, embedded applications or devices$83,531Developer, desktop or enterprise applications$81,210Developer, front-end$79,636.5Developer, full-stack$75,410Academic researcher$71,349System administrator$61,139.5Student$15,082
Responses: 2,141(4.4%)
Median yearly salary in USD
IndiaSenior executive (C-suite, VP, etc.)$55,795Engineering manager$52,308Architect, software or solutions$46,496Other (please specify):$28,949Data engineer$27,898Developer, embedded applications or devices$27,898Developer, desktop or enterprise applications$26,444.5Developer, back-end$22,086DevOps engineer or professional$20,923AI/ML engineer$17,436Developer, full-stack$13,949Data scientist$11,624Developer, front-end$10,462Developer, mobile$10,462Data or business analyst$9,299Student$3,022.5
Responses: 1,093(2.2%)
Median yearly salary in USD
United KingdomSenior executive (C-suite, VP, etc.)$163,370AI/ML engineer$149,756Engineering manager$136,141Cloud infrastructure engineer$129,334Architect, software or solutions$122,527Cybersecurity or InfoSec professional$111,636Developer, back-end$108,913DevOps engineer or professional$106,190Data engineer$102,106Developer, mobile$99,383Developer, embedded applications or devices$89,845Developer, full-stack$85,428.5Developer, front-end$84,544Developer, desktop or enterprise applications$81,685Data or business analyst$78,281.5Data scientist$73,516Other (please specify):$68,071Academic researcher$61,264Student$28,453.5
Responses: 1,485(3%)
Median yearly salary in USD
FranceSenior executive (C-suite, VP, etc.)$104,413Engineering manager$92,812Developer, game or graphics$88,171Cybersecurity or InfoSec professional$81,790.5Architect, software or solutions$81,210Data engineer$78,890AI/ML engineer$73,089Other (please specify):$72,509.5Developer, back-end$71,929DevOps engineer or professional$69,609Developer, mobile$63,228Developer, front-end$61,487.5Data scientist$60,328Cloud infrastructure engineer$58,007Developer, full-stack$58,007Developer, embedded applications or devices$56,847Developer, desktop or enterprise applications$54,527System administrator$46,406Academic researcher$38,285Student$19,954.5
Responses: 1,026(2.1%)
Median yearly salary in USD

Salary and experience by developer type

Despite having similar levels of experience (20 years, on average), Senior Executives and Engineering Managers report higher median salaries ($130k+) than Founders, Architects, or Product Managers ($92K - 104K).

What is your current total annual compensation (salary, bonuses, and perks, before taxes and deductions) in terms of your day-to-day currency? Please enter a whole number in the box below, without any punctuation. If you are paid hourly, please estimate an equivalent yearly salary. If you prefer not to answer, please leave the box empty.
Salary and Experience by Developer TypeNumber of responses6,65047Average years of professional experienceMedian yearly salary (USD) 0 5 10 15 20 25 30 35 40$ 10,000$ 20,000$ 30,000$ 40,000$ 50,000$ 60,000$ 70,000$ 80,000$ 90,000$ 100,000$ 110,000$ 120,000$ 130,000$ 140,000AI/ML engineerAcademicApplied sci.ArchitectCloudInfoSecData Eng.Data/BizData scientistDBADevOpsAITest devBack-endEnt.EmbedFEFull-stackGamesMobileEducatorManagerFinanceFounderOtherProduct managerPMRetiredSnr. executiveStudentSupportSysux
Responses: 21,629(44.1%)

4.4 Technology purchases

Influence on technology purchases

Nearly half (48%) of developers either endorsed the use of, or influenced the purchase of, new technology in their organizations last year. Twenty percent of those respondents said they influenced the purchase of a substantial addition to their company’s tech stack.

Have you influenced or endorsed a new technology purchase at your organization or sole proprietor job in the past year?
All RespondentsYes, I influenced the purchase of a substantial addition to the tech stack19.8%Yes, I endorsed a tool that was open-source and is currently used by more than just myself but no purchase was made15.5%Yes, I influenced the purchase of a tool that more than five colleagues use but it is not a substantial addition to the tech stack8.3%Yes, I endorsed a tool that was ultimately not purchased or used at my organization3.8%No52.6%
Responses: 37,341(76.2%)

What makes you a fan of specific tech tools

This focus on fundamentals is consistent. For work projects, developers prioritize APIs (Rank 1) and quality (Rank 2). For personal projects, cost management (Rank 4) becomes more important. Notably, AI integration ranks second to last (Rank 9) in importance for both work and personal projects.

The 2024 survey also highlighted the importance of APIs, noting that 75% of developers were more likely to endorse a technology if it provided good API access.

What attracts you to a technology or causes you to endorse it (most to least important)?
EndorsementOverall RankMedian RankMode Rank
Easy-to-use API142
Robust and complete API242
Reputation for quality341
Reliability and low latency443
Costs are manageable541
Connected to an open-source project651
Customizable and manageable codebase767
Good brand and public image878
AI integration or AI Agent capabilities999
Other101010
Responses: 35,897(73.2%)
EndorsementOverall RankMedian RankMode Rank
Easy-to-use API143
Robust and complete API243
Reputation for quality342
Costs are manageable441
Connected to an open-source project551
Reliability and low latency654
Customizable and manageable codebase768
Good brand and public image878
AI integration or AI Agent capabilities999
Other101010
Responses: 9,237(18.8%)
EndorsementOverall RankMedian RankMode Rank
Robust and complete API142
Reputation for quality241
Easy-to-use API342
Reliability and low latency442
Costs are manageable541
Connected to an open-source project668
Customizable and manageable codebase767
Good brand and public image878
AI integration or AI Agent capabilities999
Other101010
Responses: 24,712(50.4%)
EndorsementOverall RankMedian RankMode Rank
Reputation for quality141
Easy-to-use API242
Robust and complete API344
Reliability and low latency444
Connected to an open-source project551
Costs are manageable651
Customizable and manageable codebase768
Good brand and public image878
AI integration or AI Agent capabilities989
Other101010
Responses: 1,669(3.4%)

How you lose interest in tech tools

The reasons to reject a technology are nearly universal. The top three deal-breakers for all developers are security or privacy concerns (Rank 1), prohibitive pricing (Rank 2), and the availability of better alternatives (Rank 3). The lack of AI is the least important factor (Rank 9).

What would turn you off or cause you to reject it (most to least important)?
DetractionOverall RankMedian RankMode Rank
Security or privacy concerns131
Prohibitive pricing241
Availability of better alternatives341
Poor usability444
Inefficient or time-costly555
Outdated or obsolete technology or features658
Ethical concerns768
Lack of or sub-par API868
Lack of AI or AI agents999
Other101010
Responses: 34,188(69.7%)
DetractionOverall RankMedian RankMode Rank
Prohibitive pricing131
Security or privacy concerns242
Availability of better alternatives341
Poor usability444
Inefficient or time-costly555
Outdated or obsolete technology or features658
Ethical concerns768
Lack of or sub-par API868
Lack of AI or AI agents999
Other101010
Responses: 8,758(17.9%)
DetractionOverall RankMedian RankMode Rank
Security or privacy concerns131
Prohibitive pricing241
Availability of better alternatives341
Poor usability444
Inefficient or time-costly555
Outdated or obsolete technology or features658
Ethical concerns768
Lack of or sub-par API868
Lack of AI or AI agents999
Other101010
Responses: 23,603(48.2%)
DetractionOverall RankMedian RankMode Rank
Prohibitive pricing131
Security or privacy concerns241
Availability of better alternatives341
Poor usability443
Inefficient or time-costly555
Outdated or obsolete technology or features657
Ethical concerns768
Lack of or sub-par API868
Lack of AI or AI agents999
Other101010
Responses: 1,569(3.2%)

Count of tools used to work

Developers have many tools at work, but we asked them to quantify them this year: 54% of respondents report using 6 or more tools to do their job.

For your primary work role (student, developer, or technologist) over the past year:

Excluding general operating systems (like Windows or macOS) and web browsers, how many distinct software applications or platforms did you regularly use to create, analyze, manage, or share information in order to do your job? Please enter a whole number below with no punctuation, or leave blank.
All RespondentsNone0.6%1 - 545.5%6 - 1035.4%11 - 159.5%16 - 205.1%21 - 251.1%26 - 502.5%51+0.2%
Responses: 27,378(55.9%)

Count of tools used to code outside of work

For projects outside of work, developers typically are using 5 or less tools (65%).

For your side projects or other personal work over the past year (focus on the project you spent the most time on if applicable):

Excluding general operating systems and web browsers, how many distinct software applications or platforms did you regularly use to do your job? Please enter a whole number below with no punctuation, or leave blank.
All RespondentsNone2.7%1 - 564.8%6 - 1022.4%11 - 154.6%16 - 202.9%21 - 250.7%26 - 501.7%51+0.2%
Responses: 25,391(51.8%)

4.5 Job Satisfaction

Looking for a new role

46% of developers are not looking for a new role.

Have you considered a career change or transitioned into a new role in the past year?
All RespondentsNot looking45.6%Considering somewhat28.8%Considering strongly14.8%Transitioned voluntarily8.8%Transitioned involuntarily2%
Responses: 35,451(72.3%)

Job satisfaction

More developers are happy at work this year (24% vs. 20% last year). This is likely related to that pay bump in the data for certain roles this year.

How satisfied are you in your current professional developer role?
All RespondentsNot Happy at Work28.4%Complacent at Work47.1%Happy at Work24.5%
Responses: 26,622(54.3%)
United StatesNot Happy at Work27%Complacent at Work44.4%Happy at Work28.6%
Responses: 1(0%)
GermanyNot Happy at Work30.2%Complacent at Work50.7%Happy at Work19.2%
Responses: 1(0%)
IndiaNot Happy at Work32.7%Complacent at Work42.6%Happy at Work24.7%
Responses: 1(0%)
United KingdomNot Happy at Work31.5%Complacent at Work46.4%Happy at Work22.1%
Responses: 1(0%)
FranceNot Happy at Work27.4%Complacent at Work48%Happy at Work24.6%
Responses: 1(0%)

Ranked attributes contributing to or detracting from job satisfaction

The most important factors for job satisfaction are autonomy/trust, competitive pay and solving real-world problems (all ranked in the top 3). Interpersonal factors such as liking your manager rank much lower (Rank 9).

Rank the following attributes of your current professional job in technology according to those that contribute your job satisfaction so that the first is the most important, last is least important (if you just started a new job, consider the job you spent the most time at in the past year):
Satisfaction FactorsOverall RankMedian RankMode Rank
Autonomy and trust to manage your own tasks141
Competitive pay and benefits251
Solving real-world problems351
Innovation through solving challenging and complex problems462
Control over the level of quality in projects564
Job stability and career growth with a single employer671
Collaboration and support from a team778
Working with new technologies and tools875
You like your manager9814
Developing specialized expertise10811
Recognition from peers for your work11913
Recognition from leadership for your work12911
Expert mentors131014
Opportunities to mentor and lead junior-level coworkers141014
Other151515
Responses: 24,900(50.8%)

Is AI a threat to your job?

Confidence is slipping among developers when it comes to the perceived threat of AI to their livelihood. 64% believe AI is not a threat to their job, a decrease from 68% last year.

Do you believe AI is a threat to your current job?
All RespondentsNo63.6%I'm not sure21.3%Yes15%
Responses: 36,000(73.4%)